I haven’t been writing too much lately. Lately I have been reading annual reports and 10-Ks as this is the season where such reports get released.
I’ll throw in a few observations, in no particular order.
1. I initiated a position in a small-to-mid-cap (let’s vaguely define this as the $0.5 to $5.0 billion range) biotechnology company (USA-domiciled) that has reasonably good prospects for commercialization of their lead product with sales to commence within the next 18 months. Reading the results from the clinical trials that have been conducted, especially with respect to the competitive landscape for what it is that this company is trying to address, I suspect there is a serious under-valuation in the stock price. What remains is execution – and indeed, “execution” is what happens to investors of these types of companies when their lead products have setbacks with the FDA. However, their balance sheet is well-capitalized with a healthy 9-digit sum of cash for commercialization expenses and my inner sense suggests that it should be a 5-10 bagger over the next three years.
I don’t talk very often about the bio/pharmaceutical sector, but I do have the capacity of understanding what is necessary to invest in such types of companies. It is a very slow moving sector with its own set of economics. The last companies that I had net positive positions in were Gilead Sciences (back in 2002!) when it was apparent to me that their HIV medication (Tenofovir) was top-notch and a game changer – and also Oynx Pharmaceuticals, which had a drug that was somewhat effective in cancer treatments (Sorafenib), but I was much more tepid with. I generally have not been engaged in the sector as much over the past decade since the financial crisis but the aforementioned target of opportunity was too much to pass up.
2. Did you invest in Atlantic Power? Don’t tell me I didn’t give you, the readers, fair warning. Although their stock at US$2.83/share is not nearly as attractive as it was at US$2.20, there is still upside here. High volume on (relative) price highs suggests there’s interest out there. Again, crappy industry, but well run company. The preferred shares are also still quite attractive – in a takeover scenario, what yields 825bps today will be 625bps post-merger.
3. I learn a lot about how millennial retail investors think when reading the Reddit Canadian Investor thread. In particular, we have religious conviction in the infallibility of exchange traded fund investing, coupled with the infallibility of dividend investing, coupled with a gambling-like desire to get better returns than one would expect from a low cost index ETF. Very little have I read much about the analysis of businesses and financial statements, which isn’t surprising. But one example today is what happened to Enbridge after they announced that Line 3 will be completed a year later than expected – the stock tanked 6% today. Some people said this was a buying opportunity because of Enbridge’s relatively high yield (at $2.95/share, it means a 6.3% yield at present, not including future dividend increases). What such retail investors do not consider is the very real threat of a catastrophe killing the business – specifically an oil spill on Line 5 in Lake Michigan, or a financial catastrophe as they have a gigantic amount of debt on the balance sheet which can only be paid with after-tax cash flows (a large part currently is going out the window in dividend payments). The illusion of safety in a large business paying out large amounts of dividends is quite high.
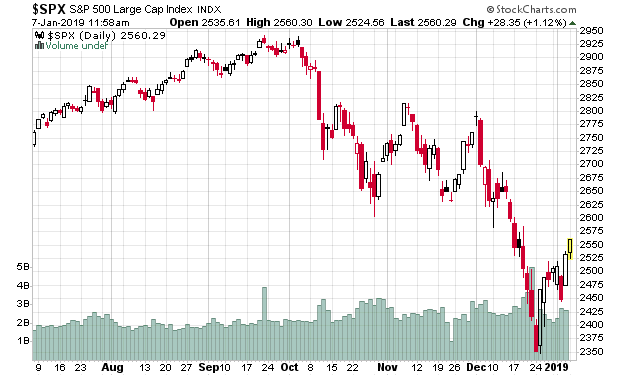
4. My small bet in late December on Canadian interest rates rising will fizzle out for a mild loss. I no longer expect the Bank of Canada to do anything on interest rates when they announce it on Wednesday morning. The central banks now are clearly too scared to do anything – raising rates will cause all of the embedded leverage in the economy to compress which will cause a recession, while lowering rates is an admission that conditions are weaker than they originally suspected and it would be an embarrassing about-face from 2018’s strategy. There is still a stealth interest rate increase going on in the form of quantitative tightening (link) but how much longer will this last? If the S&P 500, however, still stays at the present level and doesn’t exhibit much in the way of volatility that things did in the last two months of 2018, nothing will happen on the short term rate front.
Still, however, 5-year Canadian rates are 1.8% and the yield curve is extremely flat. This generally does not bode well for the economy as a whole.
5. I also took another equity position in what I would call a “very old friend” – a company I’ve been tracking for over a decade and similar to Atlantic Power, has been much-neglected and generally regarded as trash – anybody sane would have exited the company years ago. It is getting to the point, however, where it will become once again recognized by the financial market as having substance and cash flow generation capability. In a good scenario, it is trading at approximately 1 times EBITDA. Yes, 1 times. Should I call that “1 time EBITDA” instead?
The stock, sadly, is illiquid to the point where I have to be really diligent in performing trades to accumulate. I could probably move the stock 10% in a second by placing a market order. My original plan was to sit silently on the bid and nibble, but there has not been a heck of a lot of activity that hits the bids. Even then, the high-frequency traders decide to snipe me by a nanopenny and it is quite frustrating to see those trades go by. So this is a rare case where I had to pound the ask on a few occasions to assemble a reasonable position. If it trades lower I’m interested in accumulating more, but considering it’s now nearly 10% above my acquisition price I have to wait for the market to calm down further before placing further bids above my average price.
The observation here is that stocks that you’ve done some heavy due diligence on last year, five years ago, ten years ago, and even further, you still have knowledge that is better than most of the casual trading that is done in the market – keep those stocks on your watchlist even if you don’t find anything compelling today – it may be tomorrow.
6. The Canadian oil sector is still in very rough shape. Timing the comeback will result in very handsome returns, but presently, it isn’t happening. Gas entities (e.g. Birchcliff, Peyto) are somewhat more attractive, but there is also a supply glut happening that isn’t alleviating itself anytime soon. As such, fixed income is still the way to go if one has to play the fossil fuel sector, at least in Canada. There was an opening here in late December of last year, but that has mostly closed up in my opinion.
7. Alberta is going to go through an election in the next three months. Despite the fact that Jason Kenney will have a better than 90% chance of being Premier after the election, his ability to attract capital back into the Alberta oil/gas industry will be severely limited by market pricing and the federal government. There will be some other items which are investment-worthy that he will have the capacity of affecting, so investors should heed caution to Alberta-concentrated assets at this particular juncture.
8. The net of above is while I still have a healthy cash position (roughly a quarter as of this writing), I did manage to find some capital to deploy. That said, both the S&P 500 and TSX are up about 12% from the beginning of the year and I’m underperforming! Panic!
Actually, what this means is likely an illusion of safety in the broad marketplace. I’d be cautious at this point since the December dump – most of the recovery is done.