In my quest to dredge out smallcap companies, I stumbled upon Vital Farms (VITL on the Nasdaq). This was a pretty interesting case study. I’ll keep the analysis to short sentences.

Vital Farms’ niche in the business world is selling premium-branded eggs. You can imagine the marketing with pictures of farmers, and free-roaming chickens, and talking about ethical sourcing and so on. Predictably, they have supply contracts with the likes of Whole Foods. They were going into the premium-branded butter market as well but they have recently discontinued this business (indeed, dairy is a significantly different business than egg farming).
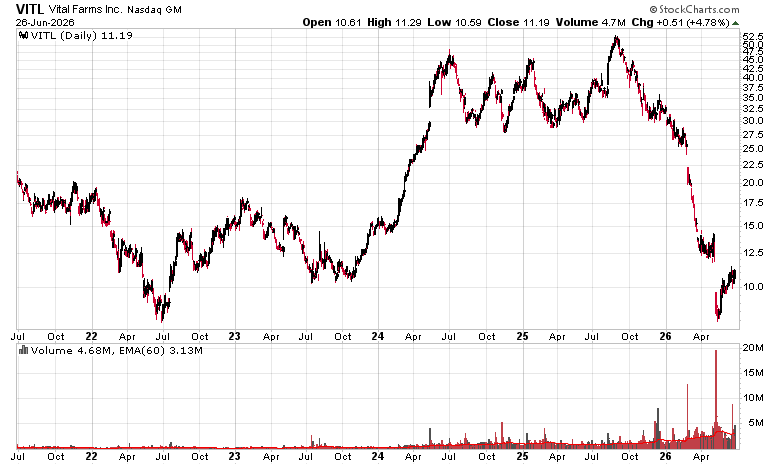
Vital went public in the start of the Covid crisis 2020 and the stock regressed until about 2023 before rocketing up again in 2024.
The reason why they rose so quickly was due to margin tailwinds concerning cost inputs (grain feeds and the like), and a perception that their total addressable market would expand further. A typical extrapolation to the max story.
Net margins after taxes for calendar year 2024 and 2025 were just under 9%, which for a commodity industry is impressive. Headline diluted EPS in 2024 and 2025 was $1.18 and $1.44, respectively, and the stock had a growth valuation accordingly – well beyond that typically afforded of most consumer staple producers.
By the end of 2025 there were some significant storm clouds approaching. One was that the company had embarked on a significant capital expenditure program which would suck up most of the money it raised from its IPO. This project (an egg processing plant in Indiana) was announced in the middle of 2024, started in the middle of 2025, and based on the economics back in 2024 – needless to say, those economics have changed.
In 2025 we had the avian flu, egg supplies in the USA had plummeted and prices started to skyrocket for eggs. The backlash of this we are starting to see with excess capacity. Blowing a hundred million on capex to expand into something that is over-supplied was not a decision that aged well.
Fast forward to 2026 and basically the bottom fell out of the company after the February 2026 reporting of annual results. A quarter later, they had reported their first loss, decreased revenues, decreased gross margins, and essentially had relegated themselves to all the characteristics of what is fundamentally a commodity business.
A social media report from a rival competitor (in January 2026) that showed that their premium eggs were not that different than typical store-brand eggs did not help their cause.
The kicker is that in Q1-2026, VITL had spent $20 million repurchasing their stock at a price which is now trading 45% under what they paid for it, and in the most recent quarter conference call, stated that they are aware with the completion of their capital projects that they will have to tap into a line of credit because they blew so much cash.
It was pretty evident from conference call transcripts that management had been drinking the coolaid (or perhaps a better analogy would be eating too much of their own egg yolks) of the perceived historical strength of their business.
While I am looking at more agricultural-oriented companies, this one isn’t going to fit the bill for me. The “regression to the mean” investment scenario should discount what happened to them in the 2024-2025 calendar period, although if you believe those days will come back, perhaps this stock might be right for you. For me, I will be looking elsewhere (including the type of eggs that I purchase at Costco!).