I’m not much of a technical analysis guru but here is my depiction of the trendline of Cenovus Energy (TSX: CVE):
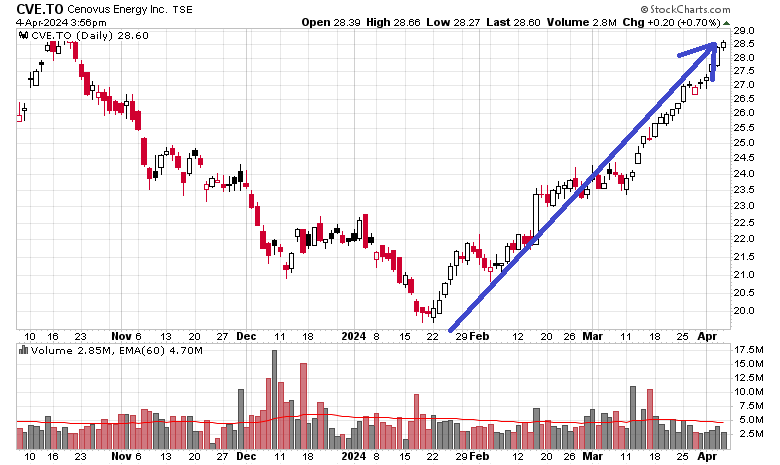
Will this go on forever and end the year at $70/share? I wish, but incredibly unlikely unless if we’re heading into Weimar Republic inflation.
Despite this price rise, the company is still relatively cheap from a price to free cash flow metric. You don’t need to have a CFA in order to do some basic financial modelling:
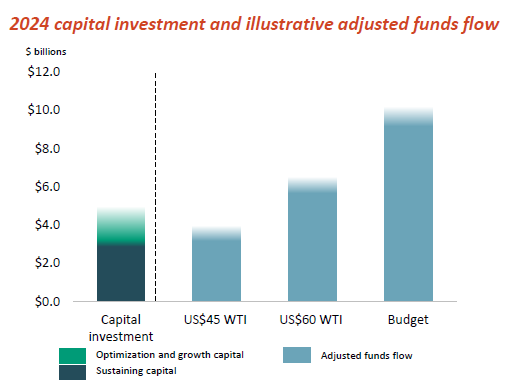
This is from their IR slides and they will be spending $4.8 billion on capital expenditures in 2024. At “Budget”, which is WTI US$75, and US$17 differential to WCS pricing, the company will do roughly $10 billion in operating cash flow, leaving $5.2 billion of it free. They also have a sensitivity of $150 million per US$1 of WTI.
Everything being equal (it is not, but this is a paper napkin modelling exercise), at today’s closing price of WTI at US$86.75, they’re looking at a shade just under $7 billion in free cash flow. It won’t be quite this high in reality, but that puts the company at around 8.5xFCF to EV even at the current price. If you were smart enough to buy it at $20/share back in mid-January, at the price of WTI then (US$72/barrel), your FCF to EV ratio would have been… about 9x.
In other words, the price appreciation is strictly a result of the commodity price improvement, coupled with a very small multiple decline (which the truer computer models out there which algorithmically trade all these fossil fuel companies on a formulaic basis perform).
For the fossil fuel components in my portfolio, I have pretty much given up on any other smaller companies other than the big three (CNQ, CVE and SU) simply because I have little in the way of competitive advantage to determine which one of the smaller companies have better on-the-ground operations and superior geographies to work with. They all trade off of the commodity curve one way or another. The “big three” are low cost producers and will generate some amount of cash going forward, barring a Covid-style catastrophic environment.
They are basically the equivalent of income trusts at the moment. Remember the old Canadian Oil Sands (formerly TSX: COS.un) before it was absorbed into Suncor? That’s exactly that these three companies are – they all have gigantic reserves and very well established low-cost operations, and capital allocation that is simply going to dump cash out to dividends or share buybacks.
Risks inherent with all three:
1. A common regulatory/governmental risk being located in Canada, and mostly Albertan operations.
2. Fossil fuels may be subject to displacement if we actually see some sort of renaissance on nuclear power (there are whiffs of it here and there, but going from speculation to reality is another matter entirely).
3. The usual cyclical supply/demand factors.
With point #3, I see in the presentation decks of most of these companies (especially the smaller ones) that they are very intent on increasing production. Despite the fact that TMX is going to be operational in a month, the egress situation out of Canada will once again saturate. No more refineries are being built and thus the demand-supply variable will likely push WTI-WCS differentials higher at some point in the near future. With balance sheets of all the companies stronger than they ever have been, there will likely be some “race to the bottom” effect coming in due course, similar to how the domestic natural gas market has been saturated – both AECO and Henry Hub commodity pricing are quite low and LNG export pricing is back to its historical levels (around US$9.50/mmBtu spot).
I think what will happen is that the higher capitalization companies will use their relatively stronger balance sheets to pick away at the entrails of the smaller, higher leveraged operations when the price environment goes sour. Given the overall under-leveraged bent most of these smaller companies have been taking as of late, this process going to take awhile and a lower commodity price environment to achieve. These are not “forever hold” companies, but certainly at present their valuations continue to look cheap.