This will be a slightly longer than usual post.
Here is a picture of the new strain of COVID-19 that the media is pumping up:

While this initially sent the markets into a panic (coupled with politicians panicking and shutting off the UK to the rest of the world), this global exercise in preying upon an utter lack of virology and immunology continues, and the true messages are coming out in the marketplace – it’s a nothing. You’d expect Carnival (CCL) or Royal Caribbean (RCL) to be a few percent down, but they’re not – down about 1% as I write this, which is market noise considering the S&P 500 is down for the day.
There are a significant number of people that actually think the news is a reliable source of information. Society has generally rewarded those that can think critically, but in this particular era, those that can are rewarded with mental health (i.e. you don’t have to live every day in fear of dying) and disproportionate gains in the financial marketplace.
So here is the story as I see it.
I am making an assumption that SARS-CoV-2 has to be the most globally tracked virus on the planet since HIV. Being a virus, it does mutate. Most people interpret the word “mutate” to be some sort of fictional character you see on fantasy movie, but a stealthy one that can’t be seen.
I’ll use HIV as an analogy for mutations. This was relevant for HIV as various anti-HIV drug cocktails started to lose their effectiveness as the surviving strains of HIV were resistant to various medications (this has more or less been eliminated with Viread and successors to the point where HIV concentrations are undetectable).
For SARS-CoV-2, just like all viruses, it has been mutating since day one. You can view a fancy map (you might want to do this on a higher powered desktop computer) of the various permutations.
Unlike the time when HIV was a real problem, today we have the advantage of rapid sequencing machines that can give a near real-time readout of viral genomes. Go look at the SARS-CoV-2 genome here.
I’m not a biologist or virologist or geneticist, but I understand enough of what I’m seeing to make a computer science analogy that what you’re looking at is assembly code for a program (virus). Even though I understand code and how assembly/machine language works from a very high level, if you give me a bunch of assembly code, I’ll have no idea what the heck it does (especially on x64 architecture!). Likewise, when looking at the various A-T, G-C base pairs, no clue.
A mutation changes the code slightly. Unlike in computer science where changing a line or two of code could break a program entirely (and indeed, the impact of such a change by a competent programmer can be predicted before hitting the “execute” button), in the biological world, changing a few lines of code has unpredictable impacts. In most cases, there is nothing seen.
Since I am using a lot of analogies in this post, it would be like measuring the performance response of your Toyota Corolla from the driver’s seat when you use 87 octane gasoline vs. the expensive 93 octane stuff.
The mechanism which SARS-CoV-2 is targeted with the Pfizer and Moderna vaccine uses a modified form of its spike protein in a manner which trains your immune system to recognize and fight it. Because the spike protein was identified early, they were able to create a vaccine in relatively quick order, early in 2020. It is only the clinical testing to prove effectiveness (and picking a proper dosage amount) that took time.
I would suspect that any mutations of the SARS-CoV-2 virus that changes the fundamental form of the spike protein to ‘evade’ immune response can also be identified fairly quickly and targeted with a vaccine. A virological cat and mouse game, so to speak.
Where else does this occur?
One example is with the seasonal flu shot vaccination.
Various strains of the flu (H1N1, H5N1, etc.) are picked based off of scientific judgement. Sometimes they pick wisely, sometimes they don’t. Unfortunately, it’s difficult to predict and measure after the fact.
It is like running an election campaign, and trying to ask yourself whether using message X helped you gain votes, lose votes or having no effect at all. You can’t “backtest” the election and run it again.
The claims of this new SARS-CoV-2 viral strain “may have increased the virus’ transmissibility by 70%” is most likely sensationalist, and a convenient political line to justify further sanctions on the populace. The underlying fact is that the virus has been mutating all the time.
Transmission is one factor, but more important is the severity the virus causes when you have it. Mutations, however, would have just as much of a chance of being less damaging than more damaging. In most cases, there is no impact clinically, similar to how HIV mutations caused AIDS.
Finally, we look at the overall clinical impact of SARS-CoV-2 infection.
British Columbia (and many other provincial/state jurisdictions) report COVID-19 statistics (search for “situation report” on this link).
In the most recent report, dated December 18, 2020, we have the following infection / ICU / death statistics to December 12, 2020:
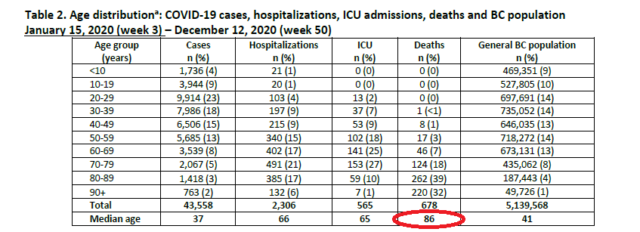
There are differences between various regions (e.g. Alabama state will have a different profile than Washington State, in weather, demographics, etc.) but in all jurisdictions across the planet there is a very obvious trend – the number of people that SARS-CoV-2 kills is in line with the overall age morbidity. Hence in the chart above, the median age of death in British Columbia to COVID-19 is 86.
What we have been seeing over the past 9 months is healthcare dictated in a large part by political decree. Lockdowns, mandatory masks, and banning of spin and hot yoga, to name some. To name all of it would be the equivalent of the 613 decrees on the interpretation of the Jewish Torah. All of this is happening in real-time before us. Good luck being in perfect compliance!
Not surprisingly, when you get politicians making centrally planned decisions on how to deal with things, you get a very lowest common denominator response (i.e. everybody stop doing everything, except those that have curried the most favour with government). Political decisions made during this situation have likely added negative value to the whole overall situation, with relatively arbitrary and in many times contradictory instructions (e.g. the rationalizations of school openings vs. no outdoor social gatherings even of three people… oh, but it is OK to go walking together, as long as it isn’t a “social gathering” and you keep 2 meters apart!). No wonder why many people are going mentally ill – most are law-abiding citizens, but their minds can’t get around the fact that inherently the instructions are inconsistent and sometimes contradictory. Politicians behaving hypocritically adds fuel to the resentment fire.
Mainstream western societal culture has an expectation of zero risk. While this has driven safety improvements of all sorts, there is a diminishing return to the drive toward zero risk. An interesting paper to read is about risk and safety. When “one death is too many” is deemed to be the standard to live up to, you can be sure that this standard will be extremely expensive to implement.
Those jurisdictions with less exacting standards will inevitably gain huge competitive advantages of those that do not. There is obviously an optimal point of safety vs. cost, and we make this tradeoff all the time implicitly (e.g. when we get behind the wheel of a car, we are taking more of a risk than we perceive), but since COVID-19 is so front and center, there is a mass availability bias effect which overestimates the perception of risk.
There is a huge disconnection between the perception of risk and actual risk. People (and this includes governments, which are run by human beings that have the same flaws and have huge incentives to causing the fewest ripples which may compromise their position) react on perceptions, not actualities.
In the financial marketplace you can make a fortune when there is a situation where the perceived risk is high, but the actual risk is low. In fact, that is one of the main purposes of investment research – getting a feel of which risks and how much risk the market is pricing into a security versus your assessment of the actual risk of the financial instrument. When the perception of risk goes lower, the price will rise, regardless of whether the risk has changed or not.
My anticipation is that this “mutant strain” is a media construct that is designed to increase the perception of risk. The actual risk has not changed that much. From SARS-CoV-2, it remains very low.
Keep your wits and critical thinking minds on, since I do not anticipate this getting better until around April, and then there will be other fires to fight.