Q&A: The oil party

Will asked:

Sacha,

How do you think the oil party will play out, with 50% of lost US production has been recovered (pre covid peak of 13.1 mbbl/d to trough of 9.7 mbbl/d and now sitting at 11.5 mbbl/d) and super majors are going for the shale again. You see it over soon with another round of massive boom (volume wise, if not price)/ bust or players become better at managing prices in a goldilock where everyone makes decent money.

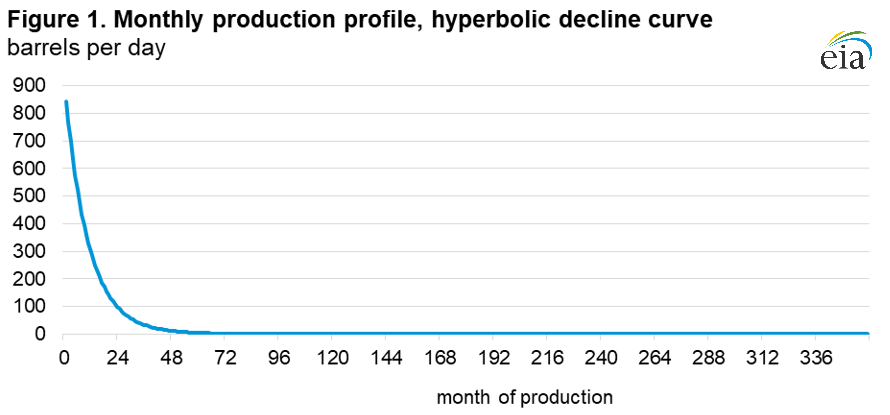
I don’t have much insight on what’s going on in the rest of the world. However, in the USA to maintain it will require a gigantic amount of capital investment and aside from the Permian Basin, most of the top tier geology has been tapped out. When you have 30% decay rates on 10 million barrels/day of production, each year you need to replace 3 million, and that’s a steep order.

You’re up against production declines like this:

What do I mean by “top tier geology”? When looking at a drill map that looks like the following (this is in the Bakken shale in North Dakota):

This is pretty much tapped out on the northwest of this specific map. I’ve seen other maps made elsewhere of entire regions being completely saturated like this.

Just like when picking fruit in an orchard, you go for the low hanging fruit first, and this is what happened in the resurgence of USA shale drilling over a decade ago. Now the geology has been tapped out – you can’t mine these areas again. They will still produce, but at much, much lower rates than the initial drill. Some of Peyto’s monthly reports get to this in detail.

Canada’s oil sands and in-situ (steam-assisted gravity drainage) projects have much better decline profiles. In addition, from what I can tell, our companies are being unusually conservative these days in terms of expanding capacity, especially these days when expanding capacity would be wildly profitable. While we do not have the power to move markets like OPEC, the apprehension is also faced elsewhere in the world, especially when there is gigantic amounts of ESG pressure (see: Exxon board election).

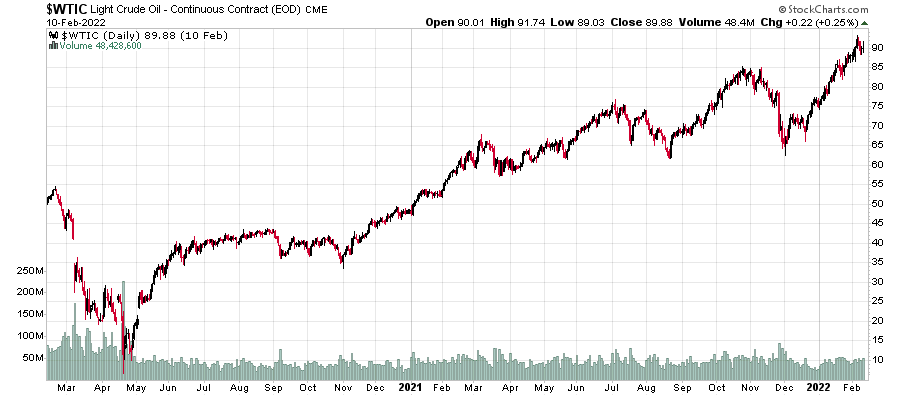
There will be a bust, but not right now. Demand is stronger than ever and the ability to meaningful ramp up supply is constrained. Any meaningful price drops in fossil fuels at this point will be on the demand side (the economic bust scenario), but even in 2020 when the world shut down for a couple months due to Covid, demand was estimated to be about 91 million barrels daily, down from about 100 in 2019.

I will also note that the measuring barometer of oil, the US dollar, should be taken into consideration. Everybody these days is forced to be a macroeconomist to properly invest in these crazy times.

Learning lessons from other people’s trading mistakes

Here is a good story for the “everybody wants to become a day trader” society I have been talking about during the Covid era.

If this article is to believed, some guy told his story about losing US$400k trading options on Robinhood. I will take this article at face value.

By the sounds of it, the person was in some sort of job that was synergistic with investing:

My job involves a lot of researching companies and trying to understand business and economic models. I like to read a lot, and there’s a lot of books on investing.

So the fellow got his start on investing in AMC and tripling it. Then he invested in silver and tripled that. Options are fantastic in that they can offer a degree of leverage that are only otherwise offered in casinos. Straight margin on equity only gets you at most 3x leverage (in addition to pesky interest expenses) so why not just go with the 94 octane?

Then this person took his life savings from his employment and his trading gains and wanted to make a big score, and he chose Alibaba.

Okay, I’m done with this. Now I want to buy a safe bet. And the safe bet was Alibaba. It had fallen from $330 to $245, but I had wanted to find a company where the price-earnings ratio was low, and every single analyst had a buy rating with like a 40-50% upside on it. Looking at all of TipRanks, my understanding was that this was a very, very safe bet with a limited amount of risk.

He found his vehicle: In-the-money call options (note BABA was at US$245):

Then I just went all in on this one single stock option: The $200 strike price call option on Alibaba.

Then he put everything into it, and believed his downside was limited.

I initially invested $300,000 in February, basically every single liquid asset in my account. Not retirement, but everything cash. I didn’t have anything left. My thesis was I might not make a lot of money, but I won’t lose much. The downside seemed limited, and that if worse comes to worse, it would go down to like $280,000.

It didn’t go well. But he decided to add:

Hey, this is gonna rebound. And as my salary came in, I saved another $100,000. So in July, I put in another almost $100,000.

The rest of the story is the trade going to zero and the person beating himself up for it.

It is one thing to learn lessons from your own mistakes. It is much more powerful to learn it from others. These lessons can be learned theoretically by sitting and thinking about it at a coffee shop or in bed, but in these days, thinking hurts a lot of people’s minds.

Lessons:

1) It is damaging for a beginning investor to be immediately successful, especially their first three trades. One will be convinced the game is easy and then proceed to bet more and more aggressively in their over-confidence until it blows up on them. The issue here is that a good investor should have a general sense of why their investments will move in the direction they anticipate. Getting the call itself correct is not good enough because the ‘why’ part of the question tells you what signs you need to look out for to get out.

In every investment, I have a general idea of what I’m looking for, and a general model in my head of what will cause things to rise or fall. Clearly if I’m anticipating an investment to fall, I don’t invest, but if you believe such an investment has longer-term potential, then this is an excellent way of testing your mental model of the company and what the market perceives of it. In general, if the company does something and the market reaction isn’t what you anticipated, it is important to examine why this occurs. There is no “one size fits all” prescription here – the intuition gets developed over many, many years (in my case over a couple decades) and most definitely can’t be learned in a few months of trading on Robinhood.

To summarize this – an investment requires you to get in, and there will be a price where you should be thinking about getting out. The “get out” point actually doesn’t need to be precisely calculated at the beginning – you can model a path in your mind for the company to get to some unspecified higher point – but without an idea of what to look out for throughout the course of the investment, you are flying blind. You might get lucky with a few trades just on sheer luck, but the variables that caused the trades to be successful will have just passed by your brain without being able to apply successful investment methodologies with future investments.

2) All eggs in a single basket. For low amounts of money (let’s say less than a quarter of annual income) I can accept an ‘all-in’ investment, but when dealing with 6-digit figures, then some component of diversification is required for reasons found in any first year finance textbooks. An asteroid might crash into the headquarters of the company. Natural disasters happen. Accounting fraud happens. I won’t talk about the obvious benefits of some diversification. Diversification these days is exceptionally cheap – you spend 10 commissions and can build up your own private ETF of 10 companies. If your portfolio is $10,000 then your one-shot first year MER is effectively 1% which is under most actively traded funds.

This guy put it all into BABA. Even if this guy put half of it into BABA and half of it into almost anything else, there would have been some degree of salvage.

3) Using call options. Options require people to bet against specific sets of variables other than the direction of the stock. If somebody has positive conviction on a stock to that degree, by most accounts it is better to simply buy equity on margin. One justification of using options would be if the options were offered at low volatility, but in the case of BABA this was not so. The usage of call options brings me to my next point, which is…

4) Using deeply in the money call options. If you had to use options and you were bullish on the stock, it makes sense to use out-of-the-money call options, which will result in a lesser amount invested in order to achieve the same delta. The scenario this person was prescribing used the wrong tool for his outlook. In addition, deeply in or out of the money options typically trade at much higher spreads, which increases the cost of trading significantly compared to using equity on margin.

5) Using P/E ratios, analyst price targets, and “TipRanks” as a measure of safety. A low P/E might be one clue, but all other underlying factors have to be examined. Why is the market letting you have this low P/E stock for so cheap? – this question must always be answered. Clearly in the case of Alibaba, a major variable in the valuation that was entirely missed by the person in question was the impact of Chinese government policy on technology firms at the time, and the perception of international investment in the country, rather than the P/E or what some analysts think the price target should be.

6) Adding to a losing position. There are times to add to a losing position. There are times to just leave it. There are times to just jettison the thing when it drops from your initial investment price. The lesson here is that you do not have to make up losses in the same stock you lost money from.

Hopefully these lessons can be ingrained in your investment psyche without having to experience what this fellow did, and if you must learn the lesson by losing money, do it with a much lesser sum of capital.

Markets are feeling a bit like the year 2000

I’ve been on radio silence lately. There hasn’t been much to write about although I am noting the ‘vapour equity’ market has seen considerable supply pressure this month.

The peak of the dot-com boom (at least as far as the stock market was concerned) was in February of 2000 when the Nasdaq peaked to 5000 and you had a whole avalanche of initial public offerings, the most notable one was the IPO of Palm (which was owned by 3Com at the time).

After that it went pretty much downhill as valuations were not supported and liquidity was sucked out of the markets. Old-value stocks (a good example being Berkshire, but pretty much any company with genuine profits that had nothing to do with fibre optics, dot-com networking or e-commerce) managed to keep their value, and in many cases some thrived in the ensuing carnage.

Investors in 2000 that kept their portfolio away from the previous high-flyer sectors would have survived to participate in the next run-up (which, in the USA, was anything related to real estate). Indeed, a successful investor across multiple market cycles must know which sectors to avoid at any given time – clearly taking permanent capital losses (anybody invest in Pets.com? EToys? CMGI?) depletes your ability to invest going forward.

We fast forward to today, where technology, software and anything related to Covid (virtual work facilitation, vaccines, etc.) is plummeting.

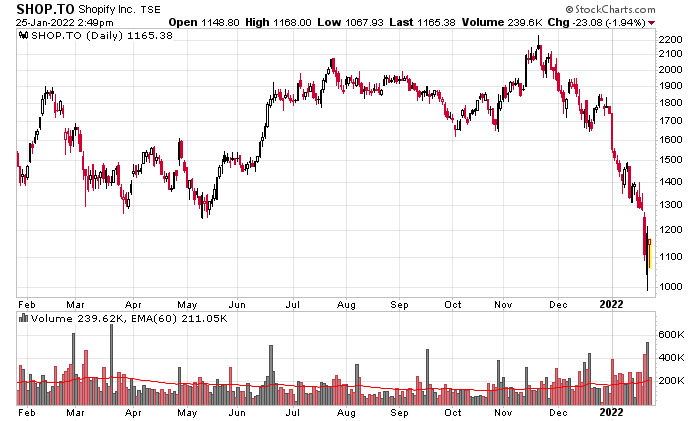
There is a lot to review, but I will keep things to Canada. There’s a lot more going on in the USA (e.g. anything that ARKK owns, for example). Anyhow, the most prominent casualty is the high-flyer Shopify (SHOP.TO), which used to be the #1 ranking in the TSX index, but no longer! They’re now back to #3 below Royal Bank and Toronto Dominion.

In the span of 2 months, they traded at a peak of CAD$2,200/share and are now down to about CAD$1,100, which is a peak-to-trough of 50%.  Anybody invested in the company since June of 2020 would have lost money. Imagine if you had bought shares of this thing at $1,800 and now a third of your capital has vanished…

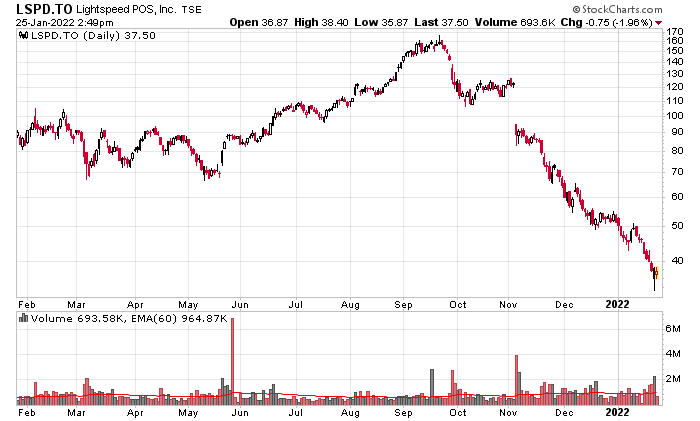
Another high-flyer has been Lightspeed POS (LSPD.TO):

The peak-to-trough ratio here has been even more extreme – from $160/share to about $37 today – a 77% drop.

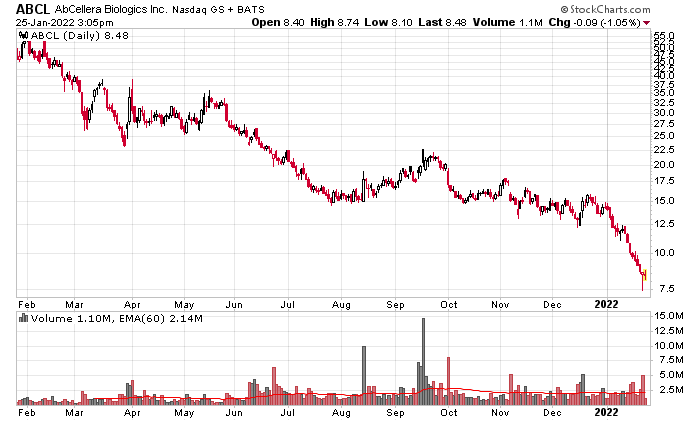
Another highly touted IPO was AbCellera (Nasdaq: ABCL) – a Canadian company that IPOed on the Nasdaq.  They went public at US$20/share and traded as high as US$70 on the day they went public, but since then it has been a decline down to $8.50 today – nearly a 90% peak-to-trough loss.

Looking at some other recent TSX IPOs we have, starting September 2021:

CPLF
PRL
QFOR
DTOL
EINC
CVO

Bringing up the charts of all of them, it’s not a pretty picture. One other notable broken IPO I examined in the past was Farmer’s Edge (TSX: FDGE) and they are down about 85% from their IPO. Another one which I didn’t write about but was an obvious avoid in my books was Eupraxia (TSX: EPRX) which I have to commend the underwriters for vomiting out that firm to unsuspecting retail shareholders.

There’s a few lessons to take home here, but one obvious lesson is that just because something has dropped by 50% or 80% doesn’t mean it is still ‘cheap’.

Many of these high-flyers that make headlines are trading at ultra-premium valuations. Take Shopify – down 50% peak to trough. While the company makes money it is still nowhere near a reasonable multiple of its existing market valuation. An investor is still paying a huge premium for assumed future growth – and the company has to exceed this in order for an investor to get a payout (never mind a dividend!).

Even in the case of companies like Lightspeed that are down 80%, it is very difficult to determine whether an investor will be seeing any returns at the end of the day – they are still losing money in their operations.

Many people got their start in investing during the Covid-19 era. A lot of them caught the right stock at the right time (e.g. Gamestop) and probably started having dreams of trading their way to riches. Without the underpinnings of understanding the fundamentals of companies, inevitably these hordes of retail investors simply traded companies on the perception of sentiment rather than any earnings power. Without having a general idea of an entry and exit point, one could rationalize GME at $100, $200, $300, etc., or Shopify at $1,500, $1,700, etc., and are effectively trading blind. One can also make a similar argument for cryptocurrency markets – functionally a zero sum game.

A good question for these new traders is – do they have the discipline to get out? Or will they try to hold on and “break even”? Or will they average down as these high-flyer shares crash back down to earth? If the 2000-2003 model is similar this time around, there will be a lot of people that will be holding onto ever depreciating shares and the current wave of hype will come to a close.

Keep in mind the simplicity that math offers – if something goes from $100 to $50, there is a 50% decrease in value. If you purchase at $50 and it goes down to $25, the result is the same – a 50% loss (and if you were starting at $100, that’s a 75% loss). In many of these cases the companies’ trajectory will head to zero, and it doesn’t matter what “discount to the 52-week high” you purchase the stock at, you will face losses if/when it heads to zero.

The safety in the markets are in those companies that are producing sustainable cash flows. You will still take a considerable hit if the company in question is trading at a very high multiple. The maximum safety are in those companies trading at low multiples to cash flows and those that are not reliant on renewing excess amounts of debt financing. There isn’t a lot of safety out there, but astute readers on this site have picked up hints here and there as to what offers a degree of safety.

The power of reinvestment and compounding returns

This post should not be news for anybody in finance, but it is worth refreshing fundamental principles of compounding and equity.

The most attractive feature of equities vs. debt is the effect of compounding. Stocks can rise infinitely while bonds have an effective price cap at the risk-free rate of interest.

To get on the equity gravy train and make outstanding returns, you need to have capital invested in a business with great prospects for reinvestment.

We will use an example of a debt-free company earning a perpetual $10 per year on a $100 investment, but the investment is of a style that does not scale upwards with further reinvestment. The long-term risk-free rate of interest is 2%. Our dream world also does not have income taxes or management expenses.

In this instance, the company can choose the following policies (or a blend thereof):
1) Give the money back to shareholders.
2) Bank its cash and receive 2% on that capital,
3) Speculate on other (preemptively higher-yielding) ventures.

If the policy option is (1) then in theory the valuation of this firm will be $500 (the risk-free rate of interest). The company will still generate $10/year for its shareholders whether the valuation is $100 or $500. An investor would be indifferent to sell the business for $500 and invest in the risk-free bond or just keep holding onto the business – you have magically created $400 of capital profit and you can clip dividends or bond coupons. With your $10/year you can do what you please, or put it in a risk-free 2% yourself.

This example is a constraint of reinvestment – after the re-valuation, your equity has effectively turned into a bond with no chance of compounding beyond the risk-free rate of interest.

If the policy option is (2) then you will see your returns in the appreciation of equity value. After the first year, your firm will generate $0.20 more in income and this will translate into $10 extra equity value, and this will compound at the rate of 2%.

Policy option (3) introduces the concept of risk – can management pull off the reinvestment? If there was an attractive investment at 5%, they would be able to generate $0.50 extra and this would translate into $50 of extra equity value for its holders, again, capitalized at the 2% risk-free rate.

So far we have made the assumption that the equity value follows lock-step with the risk-free rate of return. Of course in the real world, it never works that way and there are wildly divergent capitalization percentages used.

What is interesting is in this fictional example, the results you get if the initial equity investment does not trade at the risk-free return rate, but rather it trades at a higher rate, say 5%.

In this instance, the company would trade at an equity value of $200.

We will then consider a fourth policy option with the generated cash returns:
4) Buy back your own stock

This option requires a willing seller to the company (something that isn’t available to a 100% wholly owned firm!). Passing that assumption, an incremental deployment of $10 into the company’s own stock (a 5% reduction in shares) would result in continuing shareholders receiving 5.3% more returns in the future. Shareholders as an aggregate will still receive $10/share in returns, but the return per share will be 5.3% higher than before due to the reduced shares outstanding. This is a far better outcome than policy option (2).

The principle is the following: If a company is earning sustainable, long-lasting cash flows, it is to the benefit of shareholders that either the inherent business of the company has a capital outlay that offers higher returns on capital OR failing that, that the market value of the company’s equity is low to offer another conduit for reinvestment. Barring these two circumstances, returns should be given out as dividends.

This is unintuitive in that sometimes companies engage in really destructive practices with share buybacks. They are not universally good, especially if the future cash generation of the business is spotty. Likewise there are circumstances where buybacks work to massive benefit (a good historical example was Teledyne). However, in all of these cases, investors must possess a crystal ball and be able to forecast that the cash generation of the existing business (in addition to any other potential future capital expenditures) will be sufficiently positive over the required rate of return.

For example, Corvel (Nasdaq: CRVL) has a very extensive history of share buybacks:

The Company’s Board of Directors approved the commencement of a stock repurchase program in the fall of 1996. In May 2021, the Company’s Board of Directors approved a 1,000,000 share expansion to the Company’s existing stock repurchase program, increasing the total number of shares of the Company’s common stock approved for repurchase over the life of the program to 38,000,000 shares. Since the commencement of the stock repurchase program, the Company has spent $604 million on the repurchase of 36,937,900 shares of its common stock, equal to 68% of the outstanding common stock had there been no repurchases. The average price of these repurchases was $16.36 per share. These repurchases were funded primarily by the net earnings of the Company, along with proceeds from the exercise of common stock options. During the three and six months ended September 30, 2021, the Company repurchased 165,455 shares of its common stock for $25.6 million at an average price of $154.48 per share and 284,348 shares of its common stock for $39.8 million at an average price of $139.81, respectively. The Company had 17,763,576 shares of common stock outstanding as of September 30, 2021, net of the 36,937,900 shares in treasury. During the period subsequent to the quarter ended September 30, 2021, the Company repurchased 49,663 shares of its common stock for $8.7 million at an average price of $176.02 per share under the Company’s stock repurchase program.

We look at the financial history of the company over the past 15 years:

This is a textbook example that financial writers should be writing case studies about up there with Teledyne (NYSE: TDY) as this has generated immensely superior returns than if they had not engaged in such a buyback campaign. Share repurchases made over a decade ago are giving off gigantic benefits to present-day shareholders and will continue to do so each and every year as long as the business continues to make money.

The question today is whether this policy is still prudent. The business made $60 million in net income and there stands little reason to believe it will not continue, but should the company continue to buy back stock at what is functionally a present return of 2%? The business itself cannot be scaled that much higher (they primarily rely on internally developed research and development expenses and do not make acquisitions).

It only makes sense if management believes that net income will continue to grow from present levels. One has to make some business judgements at this point whether the company will continue to exhibit pricing power and maintain its competitive advantages (in this respect it looks very good).

Another example we are seeing in real-time is Berkshire (NYSE: BRK.a) using its considerable cash holdings to buy back its own stock. In the first 9 months of this year, they have repurchased just over 3% of the company. There’s more value right now in Berkshire buying its own massively cash-generating options than there would be on the external market – the last major purchase Berkshire made was a huge slab of Apple stock in 2017/2018 which was a wildly profitable trade.

In the Canadian oil and gas industry, right now we are seeing the major Canadian companies deal with the first world problem of excess cash generation. They are all in the process of de-leveraging their balance sheets and paying down (what is already low interest rate) debt, but they are also funneling massive amounts of money into share buybacks.

For example, Suncor (TSE: SU) and Canadian Natural (TSE: CNQ) are buying back stock from the open market at a rate of approximately 0.5% of their shares outstanding each month. Cenovus started their buyback program on November 9th and intends to retire 7% of shares outstanding over the next 12 months. The financial metrics of these companies are quite similar in that with oil at existing prices, an investment in their own stock yields a far greater return than what you can get through the uncertainty of opening up a major project (good luck getting through the environmental assessment!). My estimate at present is around 15% return on equity for these buybacks and needless to say, this will be great for shareholders.

It is why an investor should want low equity market values as long as these buybacks continue and the pricing power of the companies remain high. In the oil patch, this of course requires a commodity price that by all accounts should remain in a profitable range for companies that have had their cost structures streamlined and capital spending requirements that have been curtailed due to a hostile regulatory regime. The returns from these share buybacks are likely to be immense, barring a collapse in the oil price.

Formulating some thoughts about 2022

Light yellow line is the 10-year Government of Canada bond yield, orange line is the 2-year bond yield:

Over the past week, Omicron fears have triggered a huge demand for long-dated government debt, while central bank talks of tapering have pushed the front end of the yield up.

Indeed, when looking at the BAX futures, we have the following curve (for those that are unfamiliar, these are 3-month bankers’ acceptance futures, of which you derive the rate by going 100 minus the anticipated yield percentage, so a 98 would be equal to 2.00%):

BAX – Three-Month Canadian Bankers’ Acceptance Futures

Last update: December 5, 2021

Month Bid price Ask price Settl. price Net change Open int. Vol.
Open interest: 1,173,941
Volume: 145,981
December 2021 99.455 99.460 99.460 -0.005 136,604 34,223
January 2022 0 0 99.380 0 0 0
February 2022 0 0 99.220 0 0 0
March 2022 99.080 99.095 99.105 -0.015 242,041 25,545
June 2022 98.660 98.665 98.690 -0.030 185,438 16,971
September 2022 98.335 98.340 98.360 -0.025 167,920 15,778
December 2022 98.125 98.140 98.150 -0.015 144,759 17,816
March 2023 97.985 97.995 98.010 -0.020 107,855 13,145
June 2023 97.865 0 97.890 -0.020 62,554 10,228
September 2023 97.795 97.840 97.820 -0.025 69,061 6,586
December 2023 97.510 97.820 97.805 -0.020 38,357 4,960
March 2024 0 0 97.780 -0.005 12,729 386
June 2024 0 0 97.775 -0.010 4,613 181
September 2024 0 0 97.790 -0.005 2,010 162

The spot price is at 0.54%, while the December 2022 future is at 1.85%, which implies that in the next 12 months we will have a rate increase of about 125bps the way things are going.

The 2-year government bond is yielding 0.95% as of last Friday.  Using expectations theory, this is roughly in-line, but functionally speaking, the inversion of the yield curve is going to signal some ominous signs going forward.

Central banks are engaging in the tightening direction because of fairly obvious circumstances – there are leading indicator signs of inflation everywhere (labour market tightness AND the inability to find quality labour both count; the first is easily quantified, while the second one is not, and is a very relevant factor for many businesses), input costs rising or even being completely unavailable, energy costs spiking, etc.  With governments flooding the economy with deficit-financed stimulus, it is creating an environment where no realistic amount of money thrown at a problem can stimulate productive output.

My guess at present is that tapering and rate increases will go until the economy blows up once again – the evaporation of demand will be mammoth – when these supply chain issues are resolved, the drop-off in demand will commence very quickly.  It will likely happen far sooner than what happened in the 4th quarter of 2018 (the US Federal Reserve started shrinking its balance sheet of treasuries at the end of 2017 and the vomit started occurring around October 2018).  Indeed, you even saw hints of this economic dislocation occur in late 2019 – there was likely going to be an economic recession in 2020 even if Covid-19 did not occur.  Covid instead just masked the underlying conditions, and stimulative monetary policy coupled with shutdowns of global logistics and labour disruptions was the subsequent excuse when fundamentally things were already in awful shape to begin with.

This means that portfolio concentration (other than not being leveraged up the hilt) should be focused on non-discretionary elements of demand.

These are not serious suggestions, but Beer (TAP), Smokes (MO) and Popcorn (AMC…  just kidding!) will probably be the last industries standing among the carnage.  Even McDonalds (MCD) will not be spared as less and less will be able to afford the $10 “extra value” meals as central banks continue to drain the excess, but Dollarama (TSE: DOL) will thrive.

The conventional playbook would suggest that commodities would fare poorly with a precipitous decline in demand, but this is one of those strange interactions between the financial economy and real economy where hard assets will initially lose value in the face of interest rate increases (this has already happened), but the moment the central banks have stretched the rubber band too hard and it snaps, commodities likewise will be receiving a huge tailwind.

2022 is surely to be a worse year for most broad market investors and the public in general.  Returns are going to be very constrained and P/E expansion will be non-existent (other than by reduced earnings expectations!).  Watch out, and hold onto your wallets.  There will be few that will be spared.