While looking at the red ink that has accumulated in my portfolio, I’ve been doing some deep thinking lately. The story is not going to be that good.
In the fossil fuel world, the second quarter results are going to look really, really good from a cash flow perspective.
I anticipate a speculative run-up as a result prior to the announcement of such results. “Buy the rumour, sell the news” is a cliche that has tended to have a better than 50/50 success rate in my investment life.
Indeed, posted metrics will be so ridiculously good that it will attract people/capital that are otherwise only vaguely aware that cyclical industries require a different mindset.
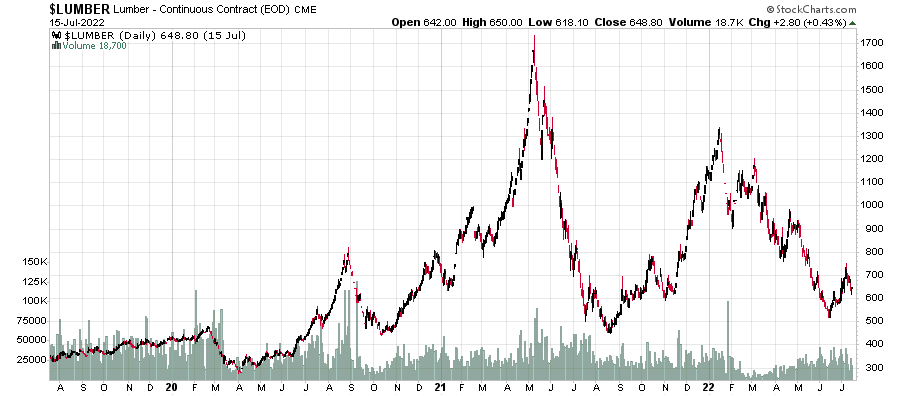
I will use Lumber as an example. It is a commodity that is much more used to ups and downs, and their physical capability has historically been punctuated by start-up and shut-downs that wax and wane with inventory levels and overall demand.
A random example of this would be the Jimmy Pattison-controlled Canfor (TSX: CFP), with my annotations on their earning history and estimated earnings:
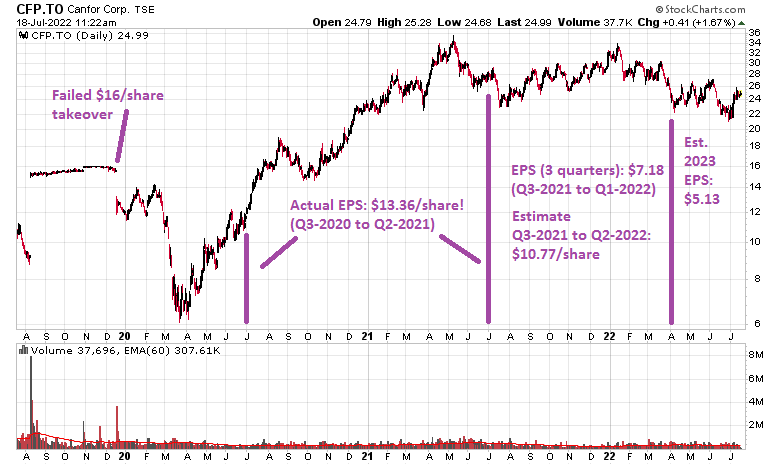
You can see on this chart that an astute purchaser would have been able to pick up shares of Canfor at (the Covid crisis peak) half earnings. Yes, a P/E of about 0.5x.
Of course, hindsight is 50/50. Many people (myself NOT included) thought the world was about the end in March 2020. But instead, Covid created a huge boom for the underlying commodity price because of a huge culmination of factors: nobody was producing, inventory levels were already low, the supply chain was wrecked, and demand was increased because many decided that building a deck or doing home renovations in the summer of 2020 was a great idea while everybody was on lockdown.
With retrospect (which would have triggered at the Q2-2020 results), the shares were trading at around $16/share – about the price that Pattison tried to take over the minority shareholders.
The acceleration of lumber pricing continued and eventually the shares normalized at around $28, or roughly 2x earnings, but normalized to 2023’s estimate, about 5.5-6x earnings. Also note how the chart hardly moved despite the “second wave” of lumber pricing from end of Q2-2021 to Q4-2021.
The earnings multiple on a cyclical company is notoriously difficult to predict – whether it is the cash flow, reserves, perceived scarcity, etc., all have a bearing on the multiple the market decides to give.
The actual cash flows that are generated, however, is internal to the company and their capital allocation scheme determines whether shareholders actually receive any monies or not. In the case of Canfor, they repaid some of their debt and engaged in some acquisitions.
Going back to the fossil fuel world, most of the Canadian complex is trading around 5x free cash flow to EV, based off of US$100 oil.
We will be seeing very different capital allocation schemes going forward. Nearly all companies are aggressively paying down debt (Whitecap is the big exception), and some are engaging primarily in dividends as a return mechanism, while some are choosing buybacks (looking at MEG Energy), and some are engaging in a hybrid approach. Investors can align their approaches to capital allocation with the managements of the various companies out there, in whatever blend they so choose. For instance, I like where Cenovus (TSX: CVE) is going, by spending cash flow to concentrate their ownership in their assets, running them well, having an integrated production and refining business, keeping a modest debt level, and then balancing out buyback/dividends. It’s a good all-in-one stock.
However, all of this might be overshadowed by one gigantic blade over the necks of the market, and that is central bank monetary policy.
Central banks are clearly in panic mode. There is a “real” component to inflation, but the “psychological” component of inflation, just like in the marketplace, is nearly as relevant. Take a look at the Home Capital Group (TSX: HCG) fiasco half a decade ago for a good example how psychology is very relevant in markets.
The theory is simple. If people believe that inflation will be higher for longer, their behaviour will be changing in conjunction with the expectations. Wage demands will increase (a good example of how this is playing out is the upcoming strike with the BC Government Employers’ union where the government offer vs. the union demand is way out of line – who the heck wants to take a 3% increase in wages when CPI is printing at 8%????). People will be spending more money today than tomorrow because the rate of interest they receive for their capital is lower than the posted CPI rate. It is like a milder version of Argentinian economics, where you discover when you go to the grocery store to buy a bundle of toilet paper, that you can only buy one roll instead of a package because the storekeeper knows that the toilet paper bundle can be sold for more just by waiting.
At a certain point, it doesn’t matter whether the actual money supply is contracting (or at least holding flat), and it doesn’t matter whether the supply chains are restoring, and it doesn’t matter how much crap gets stuffed on the shelves of Costco, Walmart and Target – if the psychology is in an inflationary mindset, it is very difficult to shake off.
This is why central banks, in theory, are regarded as independent entities, and generally are regarded as knowing what the heck they are doing to keep inflation in check (their sole mandate). They are the ones to adjust the monetary levers accordingly to keep the currency relatively level, and this stability generally breeds confidence that businesses need to make long-range spending plans.
This confidence has been badly shaken over the past couple years. First, there was “no danger of inflation”, then it was “transitory”, and now of course it is full-blown “Oh ****, we really screwed this up and really have to fix things” mode.
Ordinarily all it took for central banks to have their desired effect was to talk big – because people took them seriously and with authority, central banks could talk market expectations in a particular direction.
But now their credibility has been shot and they’re desperately playing catch-up, not on interest rates, but rather to restore their credibility. This is probably the reason why we got a 100bps increase instead of a widely-expected 75bps.
The Federal Reserve might mirror this increase in the July 27th fed meeting announcement (right now the August Fed Funds Futures are a “lock” at a 75bps increase).
However, will this be enough to shake the psychology of increasing inflation? People normally associate fiscal competence with the elected bodies (in this case “I don’t think about monetary policy” Trudeau and “mental lapse” Biden), and confidence in both are at very low levels. Despite posting record revenues (especially as they are nominal and not real dollars), governments are still posting deep deficits. As they are heavily indebted, as they roll over their bond books, they will be paying higher and higher interest expenses out of the fiscal end.
At this point, the central banks at this point have little choice other than to keep increasing interest rates until they have broken the psychology of inflation expectations. I had argued in a prior post they had to “surprise”, and the Bank of Canada judged that going 25bps over a widely anticipated 75bps was a sufficient shock. I will claim it is not enough.
Currently, we have the expectations showing that 2022 will feature a few more interest rate increases (say to 3-3.25%) but in 2023 there is an expected easement of rates, in anticipation of a recession.
The question is whether this is sufficient to break the psychology of inflation expectations. I don’t believe it will, at least over the next half year. Just looking at the price of energy, there is still going to be higher year-to-year pricing of commodities going forward until probably February 2023 – while inflation may simmer, it will be nowhere close to the 2% target level – noting that inflation is measured as a year to year comparison.
This means in order to quell the psychology, rates needs to rise even higher, and this will surely initiate huge economic troubles going forward – a deeper recession than most people probably will figure at this point.
This does not impact North America only – it affects most of the world economy, where US-denominated transactions dominate foreign trade contracts, and when the US dollar is as strong as it is, it acts like a 16 pound bowling ball ramming through the economies of the world as they desperately seek US cash – which explains the state of the Euro, Yen and other third-world currencies.
Canadian currency has somewhat of a buffer because of its trade links with the USA and commodity exposure, but if the world economic picture erodes to the point where energy consumption declines below the supply levels, surely fossil fuel commodity prices will drop and this will not be good for Canadian currency.
Also, with the rise of interest rates, both floating and fixed rate mortgage payers alike, especially for those that purchased properties in the past couple years, will be causing a lot of financial stress in the market. Your typical 25-year amortization mortgages that are up for renewal will also be paying more on this credit cycle, and perhaps people over-leveraged will be forced to sell properties. If the projected interest rate increases go higher than expectations, this will surely create some scenarios where you may see financial institutions that specialize in non-insured mortgages see financial stress and this will create more ‘interesting times’ financially.
Ultimately this depends on reading the psychology of the masses, definitely an art and not a science.
It is incredibly difficult to foresee how this plays out other than to be aware of the scenario. All I know is that caution is warranted. Especially nearing the end of this year, we might see a situation where a lot of good-quality equities out there are going to get flushed down the toilet both for tax-loss selling reasons and also because liquidity is tightening up so badly (interest rates plus QT) that players are forced to reduce leverage.
Cash is the only defense in this scenario. Everything else (gold, bitcoin, commodities, corporate debt) will take a dive, with perhaps the exception of short-dated government debt.
However, there is likely to be a “bull-whip” effect if there is such a flush-out, where those extraordinary circumstances that initiated a panic selling will likely lead to impressive gains going forward. Now is the time to compile companies on your watchlists that will likely survive the upcoming carnage.