Canaccord (TSX: CF) put forward a management-led buyout proposal of the company at CAD$11.25/share. The total price is expected to be $1.127 billion, which also includes a consortium of people, including management, of 21.3% of the company.
The balance sheet of CF is not the cleanest:
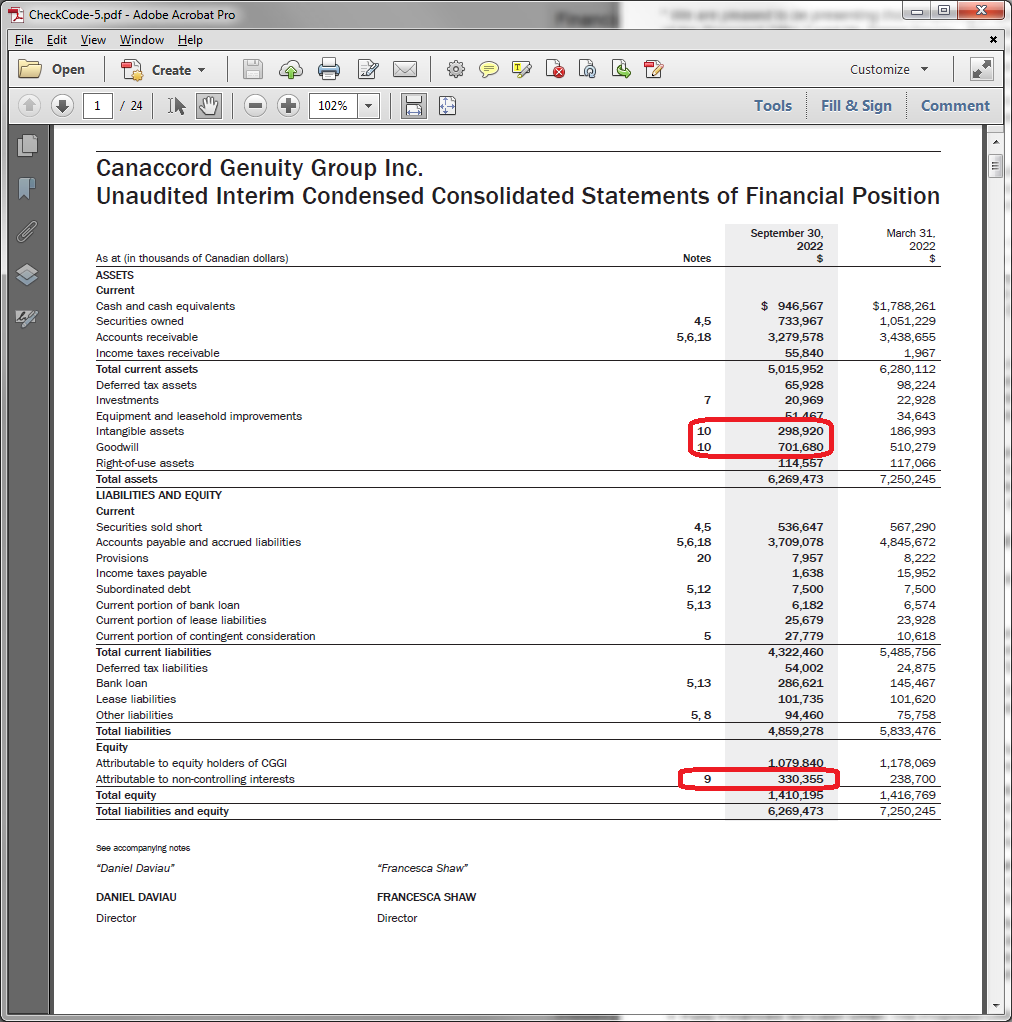
The significant amount of minority interest stems from the roughly 2/3rds ownership CF has in its UK and Australia subsidiaries (which are consolidated on the statements) – and 55% of the Goodwill stems from these divisions.
I remember looking at CF last year (when it was still around $8/share) and decided against it given where I thought the economic climate was going (2021 was a banner year for public offerings, while subsequent to this things are going to be quite dry, relatively speaking). This doom-and-gloom did appear to be baked into the stock price, but as to what degree, I could not say. Dividend investors would have been happy considering they have found a new appreciation for giving out their cash flow to shareholders.
There are a lot of companies that have “covid characteristics”, whereby one has to look back to 2019 results of being more representative of a baseline performance. 2020 to 2022 are abberations for many companies.
In 2019 (backing out dividends), CF was trading at around $5-6/share. Even after adjusting for inflation, an $8/share price seems to have embedded in a reasonable amount of risk. It was not ridiculously under-valued.
However, the special committee to review this CAD$11.25 deal is not thrilled:
The Special Committee and the Management Group engaged in prior discussions concerning a proposal from the Management Group regarding a potential Board-supported transaction to be executed by way of a plan of arrangement. The Special Committee advised the Management Group that it was not prepared to support an offer of $11.25 per common share based on the preliminary financial analyses conducted by RBC. To date, engagement between the Special Committee and the Management Group has not resulted in an agreement on a value per common share that the Special Committee could support and recommend to shareholders.
…
Importantly, the Special Committee has not agreed to recommend that shareholders accept the Proposed Offer.
One danger of investing in smaller-capped companies is that on occasion you will have management try to low-ball an acquisition of the rest of the company. Jimmy Pattison’s firm tried to take out the minority stake in Canfor (TSX: CFP) which nearly succeeded. I still remember being resentful when Cervus Equipment got taken out by management. Almost anything with the name “Brookfield” in it is susceptible to this phenomena. There are plenty of other stories out there. The danger of having these management-lead buyouts increases in proportion to the smallness of the company and the proportion of ownership of management.
As a final point, my last ownership in CF has been through its preferred shares many years ago – which I have long since sold. In early 2016 they were yielding double-digits and were too tempting to not purchase (indeed, they were a steal at the time). However, preferred shareholders get no preferred treatment as a result of this management buyout – the CF.PR.A shares traded up today, but basically at the asking price of a very high bid-ask spread. CF.PR.C traded down! The shares reset in September and June of 2026, respectively, and with current yields of 7.09% and 8.31%. If you believe that 5-year interest rates will remain at around 3.25% around the middle of 2026, the reset rate goes up considerably.