2020 Presidential Election Prediction

I write this in the early afternoon of the Pacific Time Zone so the only true data I have to work with at present is the 16 votes for Trump and 10 votes for Biden in New Hampshire, which is not exactly representative of the national vote.

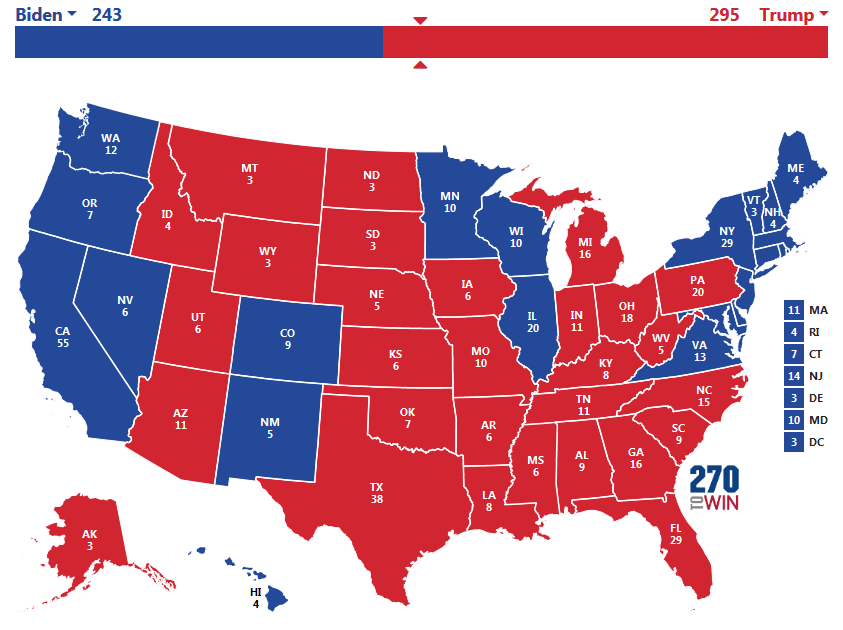
For reference, here was my November 3, 2016 presidential election prediction, where I predicted Trump 295, Clinton 243 (actual: Trump 304, Clinton 227 and 7 protest votes). The big “value-added” to that prediction, which the vast majority of others did not predict, was the breakout in Michigan.

Although all elections claim to be unique, in a sense they can be predicted to some extent given the historical correlations that various interest groups have with the red team or the blue team affiliations. Analytical minds in the major political parties try to ascertain which nudges (i.e. payouts to marginal special interests) to make to generate a winning coalition of voters. You get the numbers associated with each group, plug them into a paper napkin formula, and then build the campaign around such messaging. In 2016 it was the revival of the rust belt vs. establishment backroom politics. Trump’s team basically knew what he had to do, and aimed for a target in plain sight and got his deserved victory. Clinton’s campaign was basically “I’m not Trump”.

In 2020, times have changed. While in 2017 to early 2020 Trump was fighting the civil war in the bureaucracy (consider that a significant portion of the public service is Democratic and just because you’re the top guy in the top seat doesn’t mean that you’ll actually be able to implement policy instantaneously) and fulfilling various campaign pledges, COVID-19 completely destroyed the obvious re-election campaign pitch of “Keep America Great” to something a bit more diffuse. In this respect, COVID-19 was a net negative for Trump not because of the administration’s response to it, but because it destroyed the messaging narrative of the re-election campaign. In regards to the actual COVID-19 response, similar to Canada, the national government has limited control over the situation while provinces/states have a significant ‘say’ on what happens on the ground, which the public interprets as a national matter.

We look at the polling data. If you believe the polling data, you get an electoral map looking something like this:

In addition, congress will go Democratic, with both the House and Senate receiving Democratic majorities.

The question is – is this polling data correct? If it is, then this isn’t even going to be close. Biden wins by a mile. Indeed, in terms of the popular vote, states like California overwhelmingly will go Democratic, to the point of skewing the nation-wide popular vote by some wild margin towards the Democrats. The only reason why a Republican in California should bother up to vote is if their congressional race is in contention, or if they wish to vote in a state-wide initiative.

What polling data does not capture very well is motivation. Almost everybody you survey claims they will be voting and in reality the number is around 55-60%.  In elections where voters have the choice to not vote, it is just as important to model the cohort that vote versus those that do not.

From a more fundamental perspective, I ask what numbers of voters that voted for Donald Trump in 2016 would want to either sit this one out, or to vote Democratic – and the only people that would be in this category are the ones that believed all of the promises in 2016 (which they’d most likely turn into non-voters), or establishment Republicans that a restoration of the previous order (the Jeb Bushes, Mitt Romneys, Carly Fiorinas and the like). The first cohort is sizable; the second cohort would likely have not supported Trump in 2016.

On the flip side, there is evidence that the Republican coalition is expanding to include more of the ethnic voters (especially in the Latino/Black communities) and this has an impact in states like Florida, Arizona and Nevada. Indeed, these numbers are probably going to have a significant impact in states like Georgia, which marginally are polling Democratic this election.

Although impacted by COVID-19, you can also see that Trump has crowd-gathering abilities still, despite 4 years in office (which tend to depress voter enthusiasm, similar to how Obama’s re-election did not bring nearly the crowds that came in 2008). In fact, the crowds that still come to Trump rallies can only be described as insanely high – it is a politician’s wet dream to see such numbers coming (just imagine Trudeau trying to set something up like this).  This is contrasted with Biden, where even the most positive videos released by the Democrats don’t show that much (Bernie Sanders was much more successful in this metric).

The choice of Joe Biden is as close to a paper candidate as it gets – the whole world knows that he is not mentally functioning at a regular capacity, and that he would basically be a regent.  The VP selection did not perform very well in the campaign trail, despite hitting all of the ‘political correctness’ check-boxes.  Essentially, this renders the election as a referendum on Donald Trump – vote Democratic if you don’t like Trump, vote for Trump if you do. Are there more people upset with his presence today than they were in 2016?

Putting a long story short, to answer the original question, I believe the polling is skewed because they are not sampling the right cohorts. Here’s my guess, and it is awfully similar to 2016’s electoral map and projection:

The one state I would focus on for the Latino vote is Nevada – if the vote is relatively close (it was 47.9% Democratic and 45.5% Republican in 2016) then this state could potentially flip.

Unlike 2016, I have no money directly on the result of this election. The value received is too thin (Trump is +189, Biden is -215), compared to 4 years ago where Trump was being given away at +800 after the revealing of his politically incorrect comments.

Market-wise, no matter who wins, things are going to be in extremely rough shape. There will be a limit to the borrowing power of the US Government, and there will be a day of financial reckoning which will be extremely painful. An all-Democratic congress and presidency would be the worst outcome, while a divided congress historically is the best outcome for stability, which the markets like. But don’t believe any of these pundits that believe that Biden or Trump will be the best for the stock markets – I’d be playing the safety card.

The gong-show at Artis REIT

There’s a lot that’s happened over the weekend in the Canadian finance world, so I’m just going to do some more quick posts.

Artis (TSX: AX.UN) has consistently shown on the top tiers of my investment screens, but I’ve avoided them for some reasons that Sandpiper is bringing up – it was very obvious that the top management was mostly entrenched and very handsomely compensated. The property portfolio itself was a hodge-podge and did not seem in any manner to be exceptional (either negatively or positively), with roughly half of it in the USA and half in Canada (by NOI), and mixed usage.

A couple years ago (November 2018), Artis invoked a somewhat different capital allocation strategy, where they cut their distribution by nearly half and initiated a common unit buyback, coupled with asset divestitures. This threw away a bunch of capital in exchange for increasing the debt. One act of capital allocation lunacy was throwing a ton of money away by redeeming their G-series preferred shares for par (June 2019) when the market value was around 80 cents on the dollar.

Artis almost managed to sell itself off, highly rumoured to Morguard (March 2020), but this thing called COVID-19 derailed things. There was also clear disagreement on the proposed transaction (resulting in a Trustee resigning shortly after). I’d speculate management leaked the news to either kill the deal or to induce higher bidding among the rumoured suitors.

Finally, in September they announced a “debt reduction initiative” (which contradicts the leveraging strategy they took in November 2018) and a spin-off of their retail properties.

This apparently was the last straw for Sandpiper, which launched a proxy battle and had a special unitholders’ meeting called.

Today, Sandpiper announced they have 35% unitholder support for their slate of trustees, which is likely to result in them sealing the deal against management if it comes to a vote in said meeting. Given that 62% of unitholders voted in the September 2020 annual general meeting, controlling a 35% block is likely to be a majority of votes.

Management set a very late date for the requested special meeting (February 23, 2021), which gives them time to maneuver around, but they are likely to make it as painful as possible for the existing unitholder base before they make an ungraceful exit. There is a possibility that they will do a golden handshake deal to end things quicker. Either way, when the change occurs it will take a considerable amount of time for new management to unwind the entrenchment of the soon-to-be outgoing management.

No positions, but this is a fascinating case from a corporate governance perspective.

Genworth MI – now Sagen MI – going mostly private

This is nearing the end of the story for Genworth MI (TSX: MIC) – Brookfield is offering CAD$43.50 for the remaining 43% stake of the minority shareholders. In addition, they are ditching the Genworth name for Sagen (probably to remove any ambiguity with regards to their discontinued relationship with Genworth Financial). I don’t mind the name change, although I am confused whether it is pronounced with a soft or hard “g”.

Currently MIC shares are trading slightly higher than CAD$44, so there is some sort of anticipation of a minor sweetening to seal the deal (similar to what happened when Brookfield took over the minority stake of Teekay Offshore).

What is interesting is the following paragraph:

Following closing, Brookfield and the Company intend to continue to satisfy the public float requirement of the Insurance Companies Act (Canada) through the issuance of a new class of publicly-traded voting preferred shares of the Company, which preferred shares are intended to be issued prior to or concurrently with closing of the Transaction. A special resolution of shareholders to create this new class of voting preferred shares of the Company will be presented to Company shareholders for approval at the Special Meeting.

I do not know how this will work out in practice. I can’t think of any analogies of such publicly traded firms in Canada that have 100% of the common shares owned by one entity, but the voting rights remaining publicly traded – unless if the public listing is merely symbolic and does not actually trade in any volume. For instance, if the preferred shares have 0% of an economic stake and 100% of the voting rights of the company, what good is it if Brookfield owns 57% of these preferred shares?

In terms of valuation, in Q2-2020, the book value per share of MIC was $41.97, and on the income statement side, was supplemented by a combined ratio of 45%. Although there is a lag effect in terms of the loss ratio rising and an economic calamity (such as COVID-19), they are still minting plenty of cash. At the proposed CAD$43.50 price, shareholders are receiving a somewhat lower premium for their shares than what I would think is warranted, but this is typical to anybody that invests in an entity that Brookfield takes a bit out of – be prepared to get the short end of the stick, always.

I got rid of my shares of MIC in 2018 at a price slightly higher than the proposed takeover price, albeit I would have been a tiny bit richer had I held on – this was before the series of special dividends they declared in 2019.

This news also likely discontinues my coverage of the company – I have been writing about Genworth MI for over 8 years now. My first post about MIC was in June 2012, where I took a position at CAD$18/share. Fond memories.

The liquidity of Yellow Pages

The trading of Yellow Pages (TSX: Y) over the past week has been a relatively fascinating display of liquidity – and indeed because the publicly traded float is so tiny and volume so low, that you can review it trade-by-trade and get some insight on what is going on.

This chart does a poor job of illustrating the tick-by-tick price action of the stock.

Supply is being sucked out of the market by ETFs and algos, plus the fact that Yellow is trying to pull supply out of the market through their NCIB (limit: 2,510 shares daily). There is little demand from the short squeeze angle (short interest is about 11k shares). Although the borrow is available (IB shows 1.77 million shares available to be shorted) it is very expensive presently (30% to short). What’s really interesting are the blocks on display:

Monday (all times Pacific time zone):
12:29 Ask 5,100 @ 11.95 (not filled)

Tuesday:
Same block on the ask, trading was thin this day

Wednesday:
The block at 11.95 disappeared, and instead at the beginning of the trading day, Ask 10,000 @ 12.00. There was a bunch of volume at 11.95, and somebody front-runned the large ask by a few pennies with obvious volume.

Thursday:
The big day. Opening was Ask 10,200 @ 12.09, and there was a sizable bid (Bid 2,900 @ 11.95) which crept up in price over the next four hours. At 12:46 the block was hit, preceeded by some volume before that. The largest trade of the week was hitting the ask at 12:46:36 for 12,460 shares (multiple trades).

Friday:
A bidder appeared at 6:32 at 12.19 (1,600 shares) and this rose over the next couple hours to 12.50 (about 3,967 shares traded from the opening $12.00 to $12.50 at 7:47am). Subsequently some supply hit the market at 9:42 at 12.47-12.52, but this was quickly absorbed. From 9:57 to 12:12, there was some liquidity trading at the 12.50-12.60 level (somebody posted an Ask 5,000 @ 12.50 which was eaten in the course of an hour) and subsequently 14,740 shares traded.

At 12:12:44, somebody posted Ask 10,000 @ 12.74, and it took all of ten seconds before somebody hit the ask and picked up the shares (with 501 hidden shares at 12.70, specifically the 1 share trade was probably for the HFT processor to deliver the information before the remainder of the order was filled).

The bidder after this trade continued to increase the bid, and hit some more supply at 12.80 at 12:21:01, and finally continued to 12:59:26 where the closing trade was at 13.01.

The total volume for Friday was 35,222 shares traded, the highest since August 27.

It was very interesting week for Yellow Pages, at least in terms of how the stock traded. If they continue to financially perform as they did in Q2-2020, they should rise further. A particular price point is $19.04/share, which is the conversion price of their debentures (TSX: YPG.DB) and although they have the cash already in the bank to pay off these debentures, if the common shares trade above this, it will be akin to them raising equity financing at this price. I do not think most people would have anticipated this, especially in light of COVID-19. I still have a very significant equity position as I believe this will continue higher.

Cheapest TSX Debenture right now – Surge Energy

Just looking at the list of TSX-traded debentures (100 issues from 63 companies), price-wise, the company trading at the lowest price is Surge Energy (TSX: SGY). Their debentures (a total of $79 million, about half of which matures in the end of December 2022) are trading just a shade above 30 cents on the dollar.

Usually when a company’s debt is trading that low, a recapitalization is looming. Indeed, for Surge, it is a likely scenario, if not an outright CCAA proceeding. Q2-2020 was very rough for all oil producers, with WTIC going negative and all the Covid fallout. For Surge, the last corporate snapshot on July 30, 2020 showed a fairly dire financial picture, specifically the $307 million in senior bank debt. This credit facility goes to a redetermination on December 2020, and is otherwise payable on March 2021.

Although in a ‘normal’ environment, the corporation is cash flow positive (even after the capex), it isn’t going to be nearly enough to address the bank debt, let alone when the convertible debentures are due. The absolute amount of product being produced (17k boe equivalent with 80% crude) is well below what it needs to be to support the amount of financial leverage. Hence, the convertible debentures, being very low on the pecking order, are going to be incredibly disadvantaged if it comes to a recapitalization proposal, and are sure to be wiped clean in a CCAA arrangement. Hence, this is why they are trading in the low 30’s.

There is a winning scenario, and that involves a surge (pun intended) in oil prices. Right now the corporation is hoping they get bailed out by the commodity market before the banks close in for the kill.

I took a small loss in September bailing out what was a very small position in the debentures I took post-COVID. Sometimes debt is cheap for a reason! Or another way – just because it’s cheap doesn’t necessarily mean it’s a good value!

The next companies in line in terms of having the lowest trading prices: Supreme Cannabis (FIRE.DB), Invesque (IVQ.DB.U/.V), and Chorus Aviation (CJR.DB.A), all roughly in the upper 40’s or 50’s, and all for fairly obvious reasons when examining the businesses in question.