The trading of Yellow Pages (TSX: Y) over the past week has been a relatively fascinating display of liquidity – and indeed because the publicly traded float is so tiny and volume so low, that you can review it trade-by-trade and get some insight on what is going on.
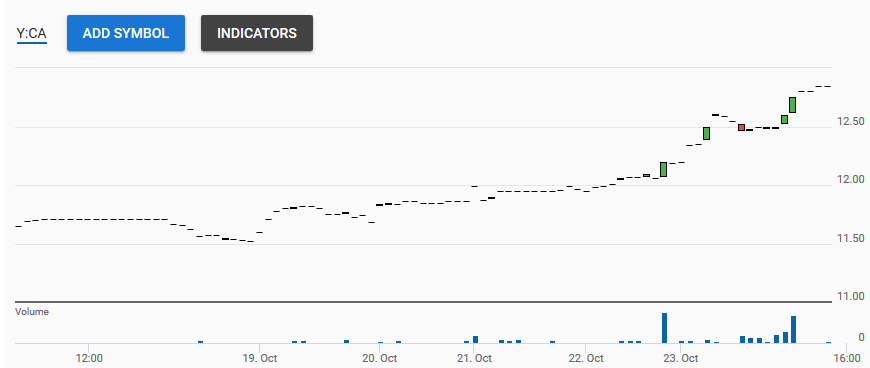
This chart does a poor job of illustrating the tick-by-tick price action of the stock.
Supply is being sucked out of the market by ETFs and algos, plus the fact that Yellow is trying to pull supply out of the market through their NCIB (limit: 2,510 shares daily). There is little demand from the short squeeze angle (short interest is about 11k shares). Although the borrow is available (IB shows 1.77 million shares available to be shorted) it is very expensive presently (30% to short). What’s really interesting are the blocks on display:
Monday (all times Pacific time zone):
12:29 Ask 5,100 @ 11.95 (not filled)
Tuesday:
Same block on the ask, trading was thin this day
Wednesday:
The block at 11.95 disappeared, and instead at the beginning of the trading day, Ask 10,000 @ 12.00. There was a bunch of volume at 11.95, and somebody front-runned the large ask by a few pennies with obvious volume.
Thursday:
The big day. Opening was Ask 10,200 @ 12.09, and there was a sizable bid (Bid 2,900 @ 11.95) which crept up in price over the next four hours. At 12:46 the block was hit, preceeded by some volume before that. The largest trade of the week was hitting the ask at 12:46:36 for 12,460 shares (multiple trades).
Friday:
A bidder appeared at 6:32 at 12.19 (1,600 shares) and this rose over the next couple hours to 12.50 (about 3,967 shares traded from the opening $12.00 to $12.50 at 7:47am). Subsequently some supply hit the market at 9:42 at 12.47-12.52, but this was quickly absorbed. From 9:57 to 12:12, there was some liquidity trading at the 12.50-12.60 level (somebody posted an Ask 5,000 @ 12.50 which was eaten in the course of an hour) and subsequently 14,740 shares traded.
At 12:12:44, somebody posted Ask 10,000 @ 12.74, and it took all of ten seconds before somebody hit the ask and picked up the shares (with 501 hidden shares at 12.70, specifically the 1 share trade was probably for the HFT processor to deliver the information before the remainder of the order was filled).
The bidder after this trade continued to increase the bid, and hit some more supply at 12.80 at 12:21:01, and finally continued to 12:59:26 where the closing trade was at 13.01.
The total volume for Friday was 35,222 shares traded, the highest since August 27.
It was very interesting week for Yellow Pages, at least in terms of how the stock traded. If they continue to financially perform as they did in Q2-2020, they should rise further. A particular price point is $19.04/share, which is the conversion price of their debentures (TSX: YPG.DB) and although they have the cash already in the bank to pay off these debentures, if the common shares trade above this, it will be akin to them raising equity financing at this price. I do not think most people would have anticipated this, especially in light of COVID-19. I still have a very significant equity position as I believe this will continue higher.
Sacha,
Any updates on your opinion of Yellow pages with the latest results. One of the major holding seems to be selling off their position.
Thanks.
In-line to my expectations. Margins appeared lower because of the $4M CEO payout (which has to be the most deserved $4M in corporate history). Goldentree did sell off 75k, this is slightly less than the amount of shares bought back to date. $137M cash as of November 11, 2020 is a good number.
Sacha,
They just released their result and still seem to generate cash. Any update or changes in your opinion?
Thanks.
The last quarterly report was slightly better than the model I had for them. They do give a ‘sneak peek’ by disclosing a month’s worth of cash differential and Q4 was $34 million, and Q1 is tracking to $30 million at present. They can justify their current valuation by stabilizing at $6-7 million/quarter FCF, a long way from current cash intake.
They are constrained on their NCIB via their debt covenant until the end of May. Their stock will probably drop until then. After May 31st, it will be very interesting to see what the capital allocation strategy will be. We should find out during the Q1 release in early May.
Sacha,
Wonder if you still like yellow pages. They seem to be in a terminal decline which nobody can turn around. Is the melting ice cube still worth it?
It depends on your modelling assumptions on this terminal decline.
Pro-forma of dividend to end of July, $91 million net cash gives an EV of about $300 million on an entity that has generated about $95 million in cash over the past 12 months, this is a pretty straight-forward spreadsheet exercise on the discount rate you’d like to apply, coupled with the slope of cash flow decline. God forbid if they actually stabilize their revenue curve.