Alternative Performance Metrics

There are two standardized mathematical methods of measuring raw performance (non-risk adjusted) and that is time-weighted and dollar-weighted returns. I won’t get into the definitions (go to investopedia for a good primer), but either method is legitimate. Typically funds that have lots of inflows and outflows use dollar-weighted returns, while time-weighted returns allows for an “apples to apples” performance comparison between funds.

Something we almost never question is the unit of measure that we use to evaluate such performance. This is most typically in the currency of the portfolio construction. For Canadians, this is usually in Canadian dollars, although it can be acceptable to use US Dollars as well.

However, is this yardstick, the currency, a correct one? It is very easy to overlook as this core assumption is baked into everybody’s consciousness that the currency is stable. Times are changing, however, where we now have to question the currency we use.

I looked at a couple alternative measures of past performance.

One alternative measure is the portfolio value in relation to the price of gold – i.e. performance in how many ounces of gold you could purchase at quarter-end. Using this metric, despite the fact that I have fared reasonably well in the COVID crisis, I have not done that much better today in relation to gold since the September 2018 quarter. In fact, going back as far as I could with some moderately reliable records, my performance, as strictly measured in gold, for the past 15 years has been about 7% compounded annually (compared to roughly 19% if you use a standard time-weighted return). This is a huge difference in performance – it shows that I am barely treading water.

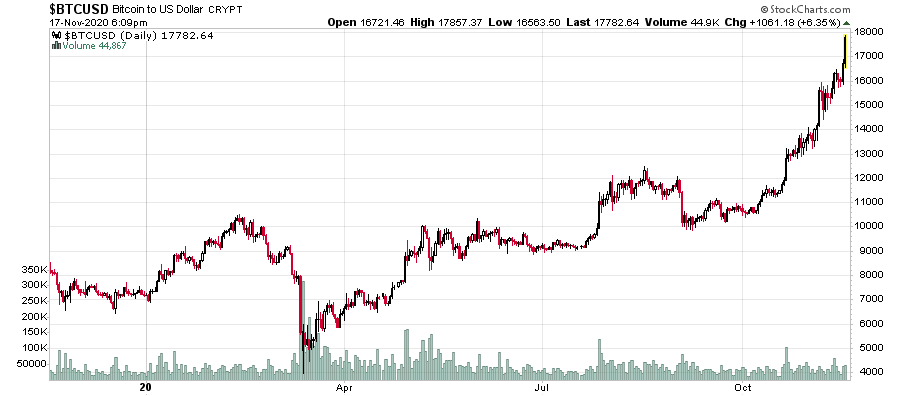
If I use crude oil as a benchmark, I’m making out like gangbusters.

Another common measure is benchmarking to an index – relating your portfolio performance above or below the overall TSX Composite or S&P 500 is popular. Indeed, when I do my regular performance reports, I include those indices as a benchmark, simply because if I could do just as well (or better) sticking my money in an index fund, there’s no point in me bothering to do any investment research at all (indeed, I’d be adding negative value with every minute spent on investment research!).

I’m always cognizant that my past performance could purely be a function of luck. While depressing to think about, it is a possibility.

Another measure is benchmarking your portfolio to real dollars (instead of nominal dollars). This doesn’t change too much since reported CPI figures are under-reported (typically around 1.5% per year), so I do not consider this a useful measure. However, for marketing purposes, fund managers can claim victory in that most of them will show “your purchasing power will increase” – a 1.5% friction to nominal performance is not too difficult to overcome when central banks are applying a category 4 hurricane tailwind to your portfolio, especially if you invested in Tesla and Nio.

Is using real dollars to benchmark absolute performance correct?

I’d view M2 as a better barometer, as it reflects the fraction of currency that you control of the entire float of currency (that gets created through loans and central bank actions). This represents cash and cash-like instruments at banks. Over the past five years, it (USA) looked like this:

Very roughly, M2 has increased about 6% a year from 2016 to 2020. Going back earlier, we have the following:

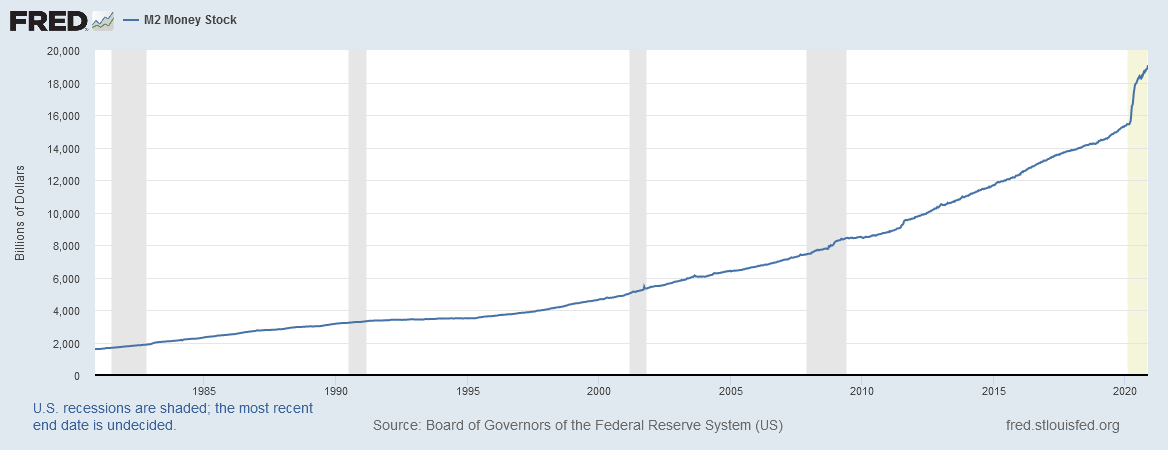
We see during the economic crisis that the overall trend did not really change (there was a mild inflection) but during the COVID crisis, it really ramped up. Assuming the year ended today, M2 in the USA has increased by a factor of 24%. Needless to say, this is unprecedented in the past 40 years of financial history.

When applying M2 from 2005 to present, the growth has been about 7% compounded annually. Hence, my “real” performance as measured by USA M2 is about 12%.

Canada (Bank of Canada Statistics) has a similar M2 curve, please forgive my thirty second excel job on this dataset:

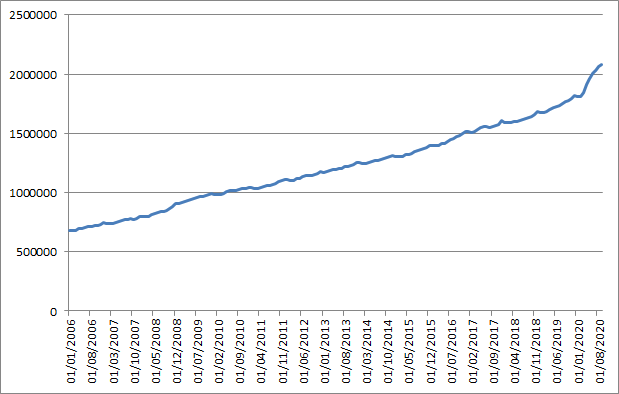
While their M2 is only refreshed up to September 1, 2020 (the USA data is updated weekly and is current), Canada’s M2 growth over the past 15 years is roughly 5% compounded. From January 1 to September 1, M2 growth in this year alone has been about 15%.

I generally believe that measuring absolute performance in relation to monetary aggregate growth is a more realistic measure than using CPI. There are still deficiencies using this as a yardstick, but the overall point of this exercise is to use different ways of measuring absolute performance.

Interestingly, if you relate USA M2 to the S&P 500 index, the price index return of the S&P 500 is roughly equal to the growth of the M2 over the past 15 years. The 15 year price return of the TSX Composite has lagged the growth in Canada’s M2 – using this metric, an index investor has barely kept afloat when you factor in dividends.

I deeply suspect we are all doing a lot worse in absolute terms than our nominal and real returns indicate – something to keep in mind when measuring our financial objectives.

Nasdaq buying Verafin

News article (Nasdaq to buy Verafin for US$2.75-billion in biggest Canadian software takeover since 2007)

The line that caught my attention was:

The purchase price, at 19.5 times expected 2021 revenue, reflects Verafin’s rapid expansion, with a compound annual revenue growth of approximately 30 per cent over the past three years. Nasdaq expects Verafin to deliver more than US$140-million in revenue in 2021.

No wonder they sold out at the price they did!

Software is all the rage currently and some are trading ridiculously expensive, even more so than 19.5 times sales, let alone earnings (want to TSX: SHOP?). Good on the ownership for Verafin for cashing out.

The article laments how Canadian technology companies get taken away, but this is a result of Canada’s regulatory and paternalistic climate – structurally designed to strongly favour incumbency entrenchment and throw talent that can innovate to the USA.

Late Night Finance with Sacha, Episode 8

Late Night Finance with Sacha, Episode 8

Date: Friday, November 20, 2020
Time: 8:00pm, Pacific Time
Duration: Projected 60 minutes. Could go longer.
Where: Zoom (Registration)

Frequently Asked Questions:

Q: What are you doing?
A: This will be an “ask me anything” edition – I’ll pick some topics of your questions and potentially answer some of them.

Q: How do I register?
A: Zoom link is here. I’ll need your city/province or state, and if you have any questions in advance just add it to the “Questions and Comments” part of the form. You’ll instantly receive the login to the Zoom channel.

Q: Are you trying to spam me, try to sell me garbage, etc. if I register?
A: I can hardly manage a mailing list without breaking my own website, what makes you think I will spam you? No, if you register for this, I will not harvest your email or send you any solicitations. Also I am not using this to pump and dump any securities to you, although I will certainly offer opinions on what I see.

Q: Why do I have to register? I just want to be anonymous.
A: I’m curious who you are as well.

Q: If I register and don’t show up, will you be mad at me?
A: No.

Q: Will you (Sacha) be on video (i.e. this isn’t just an audio-only stream)?
A: Yes. You’ll get to see me, but the majority will likely be on “screen share” mode as I explain what’s going on in my mind as I present.

Q: Will I need to be on video?
A: I’d prefer it, and you are more than welcome to be in your pajamas. No judgements!

Q: Can I be a silent participant?
A: Yes. I might pick on some of you though. Bonus points if you can get your cat on camera.

Q: Is there an archive of the video I can watch later if I can’t make it?
A: No.

Q: Will there be a summary of the video?
A: A short summary will get added to the comments of this posting after the video.

Q: Will there be some other video presentation in the future?
A: Yes.

Get ready for a big wealth transfer!

Bitcoin.

With Microstrategy (Nasdaq: MSTR) and various exchange-traded crypto funds that are blind buyers of Bitcoin, it serves to ramp up the price on a fixed float. You can even do this through Paypal, and some brokerage platforms.

In regular stock trading, you buy a stock. You hand somebody cash. The net transaction does not involve any new shares, nor does it involve any new money. The price is instead a reflection of the relative value of the stock. We generally do not think about the relative value of cash when conducting this transaction. Circumstances are changing this.

Right now, when central banks are QE’ing their currencies and governments running fiscal deficits, institutions are trying to get ahead of the curve by finding alternative forms of collateral under the presumption that the value of cash is dropping at a rate that requires a consideration to its depreciating ability to purchase other assets.

Historically, forms of collateral included salt (Roman era), spices, precious metals, and today, the backing of nothing other than the sovereign state. The fundamental value of the Canadian dollar is to pay taxes to the Crown. Every other usage of the currency is a derivative (beyond attempting to burn the plastic polymer notes for their heat content!).

Instead of holding CAD/USD, the rationale is to hold Bitcoin. There is going to be a speculative frenzy and it is going to be insane. I have no idea when it will end. Just 45 days ago, Bitcoin was trading at around $10k, and today it is touching on $18k. There is no arbitrary number this will go to simply because it is akin to a zero-sum casino where timing the exit will be everything.

The scheme ends when the last dollar has been sucked into the demand side of Bitcoin, just like a good old fashioned Ponzi scheme.

Maybe the trigger comes in the form of confidence restoring in the US currency. Perhaps this comes in the form of the Bitcoin transaction network collapsing or being manipulated to an extent that limits its usefulness. Perhaps Bitcoin transactions become completely prohibited by sovereign governments (and indeed, Bitcoin transactions that post on the blockchain are open for everybody to see – it is the least anonymous mechanism possible).

I’ll let other people play this game, but the speculation fury is going to be intense. The narrative (that US currency is doomed) is a great story and easy to understand. My suspicion is that it is early in the process. What happens if Bitcoins head up to $100,000? $1,000,000? The people invested in Bitcoins will have some price they will want to liquidate.

I’ve been very wrong on Bitcoin for a considerable period of time, so please do not give me much credibility when I talk about this cryptocurrency. Perhaps I am too old fashioned and behind the times.

The good news is that alternative forms of collateral come in the form of assets that produce goods and services that will clearly be in demand in the future. They have less speculative fury and much less visibility, but unlike Bitcoin, I won’t be worried about when they crash when everybody runs for the exits.

The biggest single stock re-indexing in history

This will be written about for years, if not decades to come.

The insertion of Telsa (Nasdaq: TSLA) stock into the S&P 500.

Tesla is projected to be about 1.01% of the index, although this will certainly rise as the re-indexing occurs. Already speculators have shot the stock up another 14% in after-hours trading. Tesla’s market cap is about $440 billion. S&P estimates that about $50 billion will be indexed to Tesla stock, and this is effective December 21 (when the rest of the index is also rebalanced). They released a short consultation whether institutions want to include the stock in tranches or in one gigantic bite.

Normally inclusions (and deletions) are given shorter notice, but presumably they thought they needed to give a whole month to do this one. What’s going to happen is there will be intense games played with Telsa, the likes which will never have been seen in history. Every day trader on the planet will be on this like moths to a raging flame (and indeed, some of those moths will get engulfed into the fire!). This will be one to watch. Of course, I’m too old to be doing the daytrading but I’m sure all those Robinhood players will have fun, especially with casinos still closed.

Tesla’s products are great, but valuation-wise one has to think that this really feels “toppy”, including the index as a whole. Perhaps monetary policy is such that default capital continues to get parked into the index, valuations be damned.

So the conclusion is that we have a captive buyer that is forced to pile $50 billion into a single stock. Who’s going to sell?