This is going to be a fairly rambling post, be warned.
After the first week of the year, I extrapolated that by the end of the month that I would be bankrupt. I was then carefully preparing my own bankruptcy filing and then things went 180 degrees from there onto the upside, so I’ve had to shelf my consumer proposal until the next market downturn.
As some of my readers may know, I have been in a state of confusion and have found the cross-currents to be very difficult to swim in. The good news is that despite being jerked around in the currents, the lifejacket I am wearing is very buoyant and to quote our Prime Minister, “the portfolio will take care of itself”.
That said, I am always on the lookout to add value where possible, but the hurdle rate for cash (nearly 5%) is the highest it has been since before the 2008 economic crisis. This brings a different variety of challenge, namely that the speculative winds are blowing in rather odd directions.
Natural Gas
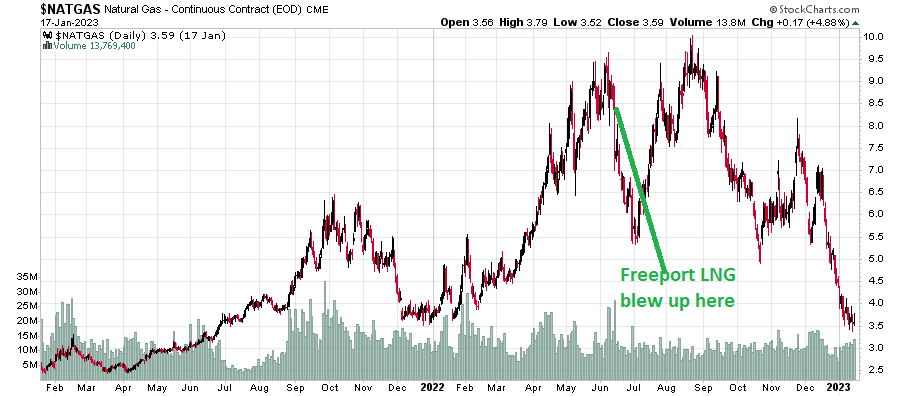
Partly due to a very fortunate warm winter in Europe, the commodity price of natural gas has been completely hammered down:
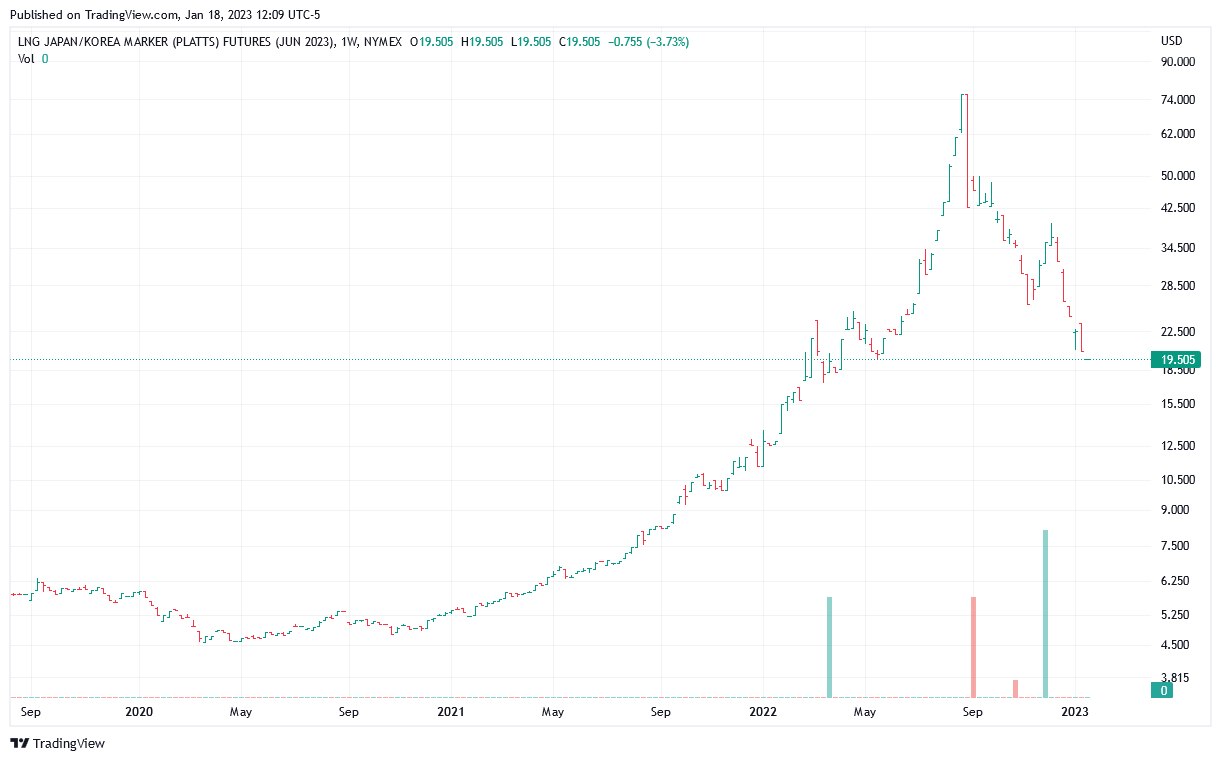
Because of this, LNG delivery prices to Asia (I’ll use the summer 2023 chart, but you can choose whatever delivery date you want) has gone from something huge (up to $76/mmBtu!!) to $19 today:
People that have leveraged long on natural gas have gotten killed. Interestingly enough, the impact on equity prices has not been as terrible as the charts would indicate, but this is because company capitalization rates have increased. The simplest entity that characterizes your typical Canadian (exclusively Alberta) natural gas producer is Birchcliff Energy (TSX: BIR) and they give fairly detailed (and perhaps more importantly, honest) guidance and effectively at this point it is a direct proxy for spot gas with some linkage to Dawn, Henry Hub and AECO. When natural gas was making its highs, the company was trading at around 4x free cash flow to EV. Today, the company will be making less than half of what it would be three months ago, but the EV/FCF ratio has increased from 4 to 9, so the stock has only taken a mild hit (about 20% below the October peak). Even day-to-day trading has exhibited less correlation to spot prices, which I am finding interesting. Are markets slowly pricing in other variables than cash flow (e.g. reserve capacity)?
Bed, Bath and Beyond
I must say, this has been as fun as Gamestop in the glory era to watch trade:
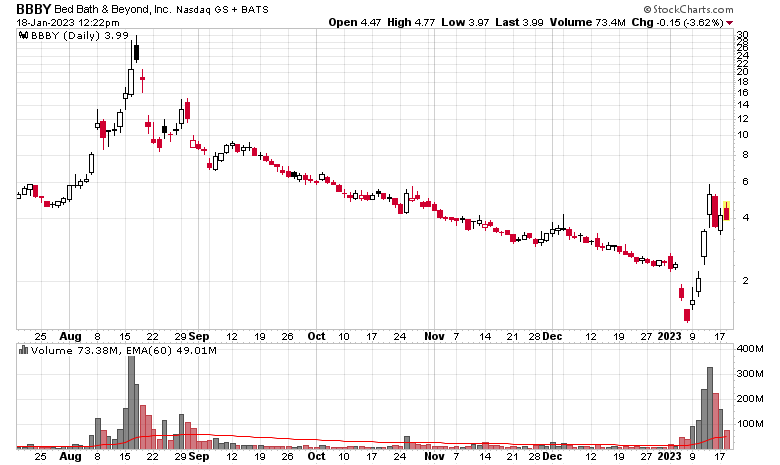
Shares are not available for short sale, and what kicked off the recent price spike was rumours that the company was shopping around for bankruptcy consultants. Needless to say, the company is in awful financial position. They filed for a late 10-Q on January 5th, and had the following paragraph:
While the Company continues to pursue actions and steps to improve its cash position and mitigate any potential liquidity shortfall, based on recurring losses and negative cash flow from operations for the nine months ended November 26, 2022 as well as current cash and liquidity projections, the Company has concluded that there is substantial doubt about the Company’s ability to continue as a going concern.
This is a “brace for impact” statement.
Let’s get a little more specific – at the end of November, they had $153 million cash in the bank and $1.9 billion in debt (not including lease liabilities, something that would be considered critical for a retail operation!). Add onto that $400 million of cash bleed in the three months ended in November, and suffice to say, this is like a 747 jetliner that is a thousand feet above the ground and heading down at a 60 degree angle. It is not pretty. The publicly traded long-term debt is trading at around 5 cents on the dollar.
However, the equity is going wild.
What is the conclusion that you can make from this?
My obvious take-away: Interest rates still have to rise. There is still plenty of speculative capital sloshing around in the marketplace and until this speculative fervor gets suppressed, money is still loose.
Office REITs and REITs in general
Despite rising interest rates, the REIT sector, and most of all, office REITs appear to be doing very well.
Allied Properties (TSX: AP.UN) was the poster child for depreciation in 2022, but is up 17% YTD as I write this.
Dream Office REIT (TSX: D.UN) is up 13%.
Even residential is doing reasonably well – the bellweather in this space, (TSX: CAR.UN) is up 12%.
Given that many of these REITs have fixed debt exposure that has to be renewed over time at interest rates considerably higher than what the maturing debt is, this price action is surprising, especially when you model out the reduction in available free cash to unit-holders at the higher rate of interest.
I don’t know what to make of this. Is real estate a flight to safety despite rising rates?
Gold and Bitcoin
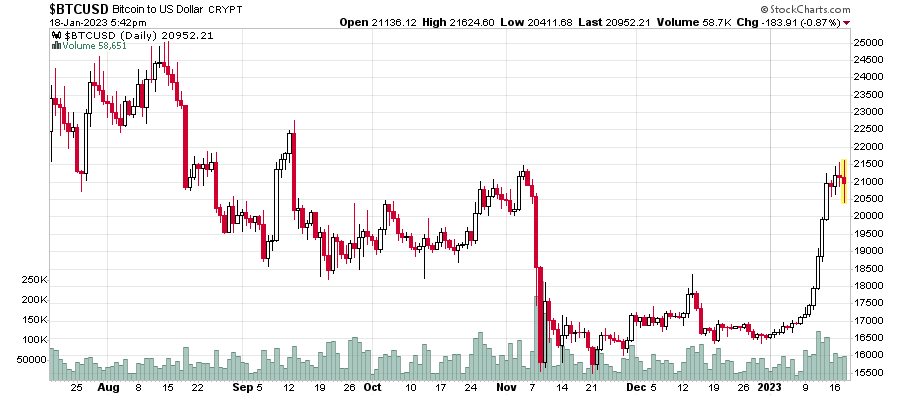
Both have been very strong early this year. Bitcoin, in particular, ripped upwards in January:
Gold has been on a steady incline since last November as well:
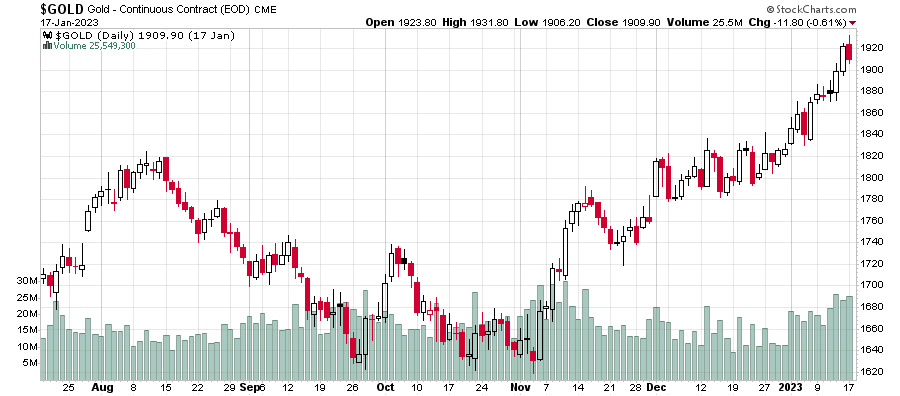
While Bitcoin and Gold do not pay interest, against an inflationary backdrop they have some semblance of a “real” return. Just like REITs, is there a safety element in play? Or is this a play on the general state of monetary policy? Cash is trash, even if it pays 5% interest?
Picking up shares of illiquid stock
My due diligence screens finally picked up a target candidate. Unfortunately, my timing on my “greenlight to buy” occurred just as the stock was jetting up (which I notice is a general trend for the overall markets in January):
It’s obvious that somebody else has some great ideas as well at the same time as me, but I also am wondering whether my own brokerage firm is trying to front-run my own slow trading? Should I just wait for a big ask in the future (not too common) and just hit it?
Hi,
it was my understanding that the Canadian Natgas Producers have somewhat been isolated (due to lack of transportation capacity) from world market events-this might explain the moderate sell off (the sell-off in Vet.to has been more severe, for instance) – AECO lagging HHub, let alone European spot prices in absolute terms.
Your EV/FCF figures -from 4 to 9 – suggest otherwise, though
The important question is: is the current EV/FCF multiple (9?) a bottom, or top cycle multiple. Am I wrong to believe this FCF is closer to the bottom (eyeballing the first chart)?
I do think there is tremendous long-term optionality in this name, not only with respect to gas prices, but also with respect to linking the price of output to the world market…
For the specific companies (TOU, ARX, PEY, BIR, SDE, etc.) noting where they make the actual sales is important, in the case of BIR, they a considerable component currently to Henry Hub and Dawn (Dawn is more aligned to HH than AECO in pricing).
For the entire oil/gas complex, the EV/FCF number rises when the commodity price environment goes down, which makes sense, but the first derivative of EV/FCF with respect to commodity pricing is always a mystery and indeed one wonders whether the big institutional money out there trade it on some curve and what the other input variables would be (interest rates, for one).
I think this is giving too much credit to “big institutional money”. There are far too many uncertainties at play in O&G prices. If anyone is sticking to a model – it is a cinch to bet against it.
Tonken on BNN said if they need to this year they will take on debt to support the dividend. Maybe they should have gone with .40 a year instead of .80. Go through all that to pay it off and then go back into it for a dividend? I remember back probably 5-6 years ago him being on BNN talking about how great they were doing and they were in strong position right before the bottom dropped out.
The debt they have on the books is almost immaterial in relation to the free cash flow. As long as you believe Henry Hub isn’t going back to $2 gas…
The claim they can maintain a $0.80 dividend (which implies $213 million FCF) is at WTI 70, AECO CDN$3.00, DAWN US$3.25 and HH US$3.35.
BIR and natgas stocks valuations might make more sense if you used 1 or 2 year out NG price rather than spot … lower number, less volatile, and more correlated with projected earnings
I always take the average of the next 12 months on Henry Hub. Right now US$3.61.