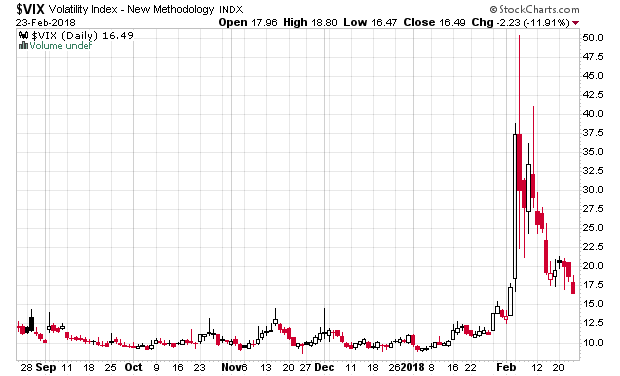
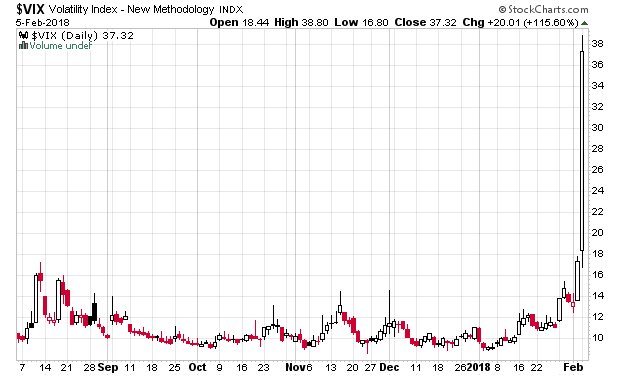
Volatility

I thought my previous posts about raising cash were correct, but I wasn’t expecting it to be that correct.

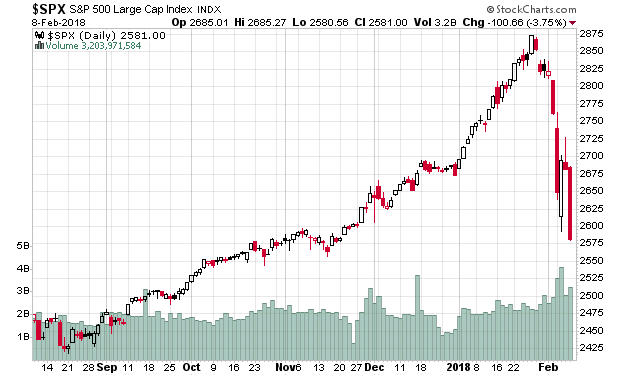
Picking through the entrails of this mini-crash, I actually don’t see much signs of margin liquidation – this was an old-fashioned concurrent stampede of trading that wanted to get out all at the same time, and they did it with the high-capitalization stocks.

I didn’t see much of an effect on the Canadian market. Normally there is a bit more correlation. I’d expect to see smaller, less liquid issues being sold off as people panic to sell anything to raise capital.

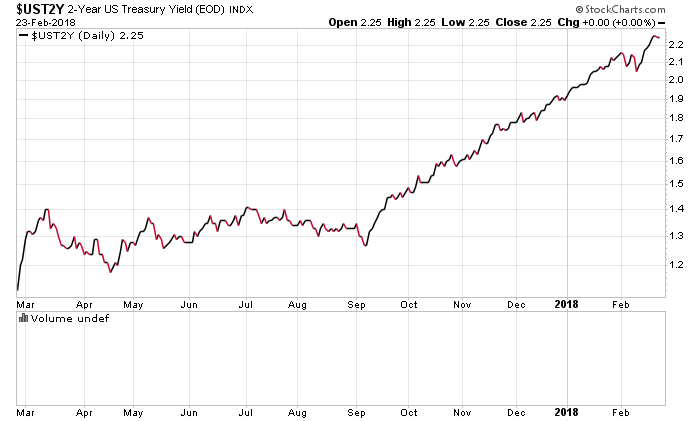
Something else odd was that normally when the market crashes like this, the 30-year treasury bond yield drops a lot, but like the past week, the equity and bond prices (not price-to-yield) are correlated.

This is one of the oddest high-volatility periods I’ve witnessed. It reminds me of the spring of the year 2000. Normally I should be deploying capital when the volatility index is high, but this is a one-day spike and it is nothing sustained. I would not be surprised at all to see a huge rally up followed by another gut-wrenching crash later.

I already have a list of stocks assembled for purchase if the price is right, but currently, the price is not right.

With the decline of the Canadian dollar, my portfolio (as measured in Canadian dollars) actually rose on Monday.

Finally, the S&P 500 at 2648 means that it is down for the year. I’m finally outperforming again.

S&P 500 year to date

Caution investors – if your portfolio hasn’t risen +7.4% since the beginning of this year, you are underperforming! (Just for disclosure, I am underperforming the S&P 500 year to date!).

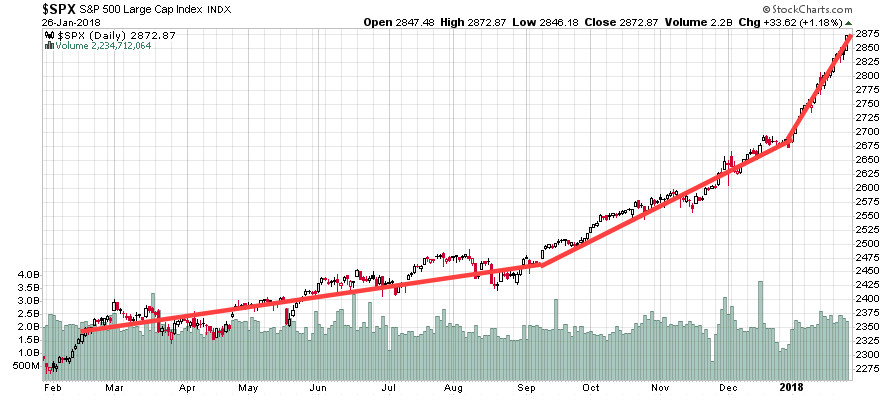
I’ve attached the above chart to show how parabolic things are going to get over the next little while.

I can just imagine clients telling their value managers about how much their friends are making on cryptocurrencies, marijuana, and also by people just dumping money in the top 10 large-cap companies, irrespective of any fundamental underpinnings of these corporations.

There are times in financial history where this has occurred before. I’m thinking 1999 or early 2000. It doesn’t end very well.

Raise cash. It is the most difficult trade to hold cash right now – precisely why it is correct.

Looking at the losers of 2017 (TSX)

Purely for reference – look at the victims of 2017 market action. A lot of gold, oil and gas, and Aimia!

Some of these are also on the September 2, 2017 screen I did. The only difference with this table is that I did not restrict revenues and had a minimum market cap of $25 million.

Entities included also are ones that have not been delisted (e.g. Sears Canada).

Any pickings on these entrails that are worth looking at?

CompanySymbolYTD (%)
CPI Card Group Inc.PMTS-T-82.5
Platinum Group MetalsPTM-T-80.67
Asanko Gold Inc.AKG-T-79.37
Intellipharmaceutics Intl. (D)IPCI-T-74.41
Concordia International (D)CXR-T-74.39
Electrovaya Inc.EFL-T-70.89
Painted Pony EnergyPONY-T-69.85
Aralez Pharmaceuticals Inc.ARZ-T-69.37
Condor PetroleumCPI-T-68.65
Neovasc Inc.NVCN-T-67.67
Oryx Petroleum CorporationOXC-T-66.98
Mandalay Resources CorpMND-T-66.88
Bellatrix ExplorationBXE-T-66.09
Euromax ResourcesEOX-T-60.77
Western Energy ServicesWRG-T-59.68
Dundee Corp.DC.A-T-58.49
Pine Cliff EnergyPNE-T-58.41
Eldorado GoldELD-T-58.1
Perpetual EnergyPMT-T-57.87
Aimia Inc.AIM-T-57.83
Red Eagle MiningR-T-57.33
Crew Energy Inc.CR-T-56.86
Newalta CorpNAL-T-55.6
Peyto Exploration & Develop.PEY-T-54.17
Western ResourcesWRX-T-53.89
CRH MedicalCRH-T-53.84
Bonavista Energy Corp.BNP-T-53.22
Birchcliff EnergyBIR-T-53.04
Tahoe ResourcesTHO-T-52.57
NeuLionNLN-T-52.17
Cardinal Energy Ltd.CJ-T-51.65
TAG Oil LtdTAO-T-50.65
Storm Resources Ltd.SRX-T-50.57

Raw transaction costs – Commissions

I’ve been compiling some data for the year-end.

One statistic I track is my transaction costs (i.e. commissions of transactions).

If I’m generating performance that is below the market averages, I should immediately quit and just invest in a bunch of low cost indexes (Canadian Couch Potato is mostly cited in this respect – I will not offer opinion on it, and Vanguard Canada in general is quite low cost). In general, you can invest in a basket of well-diversified stocks and bonds at a management expense ratio of roughly 0.1-0.15% of assets.

It actually isn’t readily obvious whether higher transaction costs is a detriment to performance when one’s performance is higher than the market averages. Can one instead make a case that lowering the volume of transactions will actually increase performance?

The way I try to measure performance is applying the “What if I were to be struck by lightning at any point in time, how would my portfolio fare” test, where if I would arbitrarily freeze things at one point in time – e.g. January 1, 2016, how would I have fared today compared to my present value had I not conducted any transactions since that date? (I don’t answer this question in this post, but consider it for your own portfolios – it is an interesting exercise when you discover that you have two-year streaks where clicking buttons is negative alpha!).

Getting back on topic to transaction costs, over the past decade, this number (as a function of year-ended assets) has been between 0.05% to 0.81% (the 0.81% year was in 2008, which for understandable reasons, was a very volatile year for trading – while losing 9% for the year, I out-performed the S&P 500 by over 25%). The number should decrease over time as asset values have increased.

2017’s year-end number (I do not anticipate making any trades on the last day of the year) is quite close to the low end of my past transaction cost range.

Commissions these days are so low that trading execution is a much more dominant factor in terms of reducing the frictional costs of transactions, but keeping records on raw trading costs I find fascinating. I cannot be accused of over-trading, but always look for methods to optimize how I scale in and out of positions – every basis point of performance counts, especially in today’s non-volatile markets.