Yesterday, I finished the Vancouver Sun Run, a 10km road running event and the 3rd largest in North America. This year I finished in 54 minutes and 37 seconds, which despite my increasingly older age and having a body mass index higher than ideal, was my lifetime best. A decade ago, I took nearly a minute and a half longer. Other than trying to weave around the masses of people, I find thinking about abstract issues to be a good way to pass the time while in the process of running.
I will make a claim that mental discipline is necessary in order to sustain above-average performance in finance.
You might be able to do well in part of a financial cycle without mental discipline, but eventually all the monolithic dot-com investors in 2000, US real estate in 2007 and presumably now cryptocurrency and marijuana investors that thought (or still think) their investment vehicle was a one-way street to perpetual riches have had to face severe setbacks in their ambitions. In particular, when the market goes south determines whether your mental fortitude breaks and gets you to sell at the bottom, which many equity investors did in 2008 before seeing things rocket up again after February 2009.
Finance is a rare industry on the planet that exhibits inverse demand characteristics in that in many cases, a higher price induces more willing buyers for the product. Conversely, stocks that are trading low (and have downward trajectories) are frequently shunned and less people are interested.
In many cases, the price action is warranted. There is a feedback mechanism where people believe the market price is indicative of the relative fortunes of the underlying companies – basically believing that the crowd is smarter than they are.
One of the greatest tests of mental discipline is having something you buy in the marketplace go south in price. You invest a dollar today in something you think is worth double that. However, you wake up in a day seeing it is now valued at 90 cents. And the next week it goes to 80 cents. If your initial analysis was correct, the obvious and rational decision is to buy more. But there is always an inkling in the back of your head that you can be wrong and the market is clearly making you out to be a sucker. You never know except with the hindsight of retrospect – and then it is always too late.
Mental discipline is all about knowing what to do in these situations. There is no prescriptive formula because all situations are inherently different – it could be the case that your $2 analysis was completely junk. It could be the case that the CFO in the firm was actually cooking the books or the CEO was a complete fraud himself. Or it could be that what is now an 80 cent investment is still truly worth $2 and that future investments are going to be worth 150% of what you paid for instead of 100% at your original cost.
Mental discipline is what allows you to sort this out without making stupid decisions like averaging down to zero or holding excessive concentration. Mental discipline is also what allows you to exit at a loss and not feel the compulsion to “break even”. There are plenty of psychological traps of investing and mental discipline is what allows one to rationally navigate through it all.
Mental discipline is part of being mentally fit – i.e. having the psychological processes set in mind, and consistently reinforced to be able to function in the financial marketplace. Other aspects of being mentally fit include having the proper repertoire of knowledge, including knowing how to read financial statements, understanding businesses, math and statistics, economics, etc. All of this contributes towards mental fitness that makes one a better investor than those that do not have these key aspects of knowledge. Being able to distill all of this acquired information and knowledge and separate what is important from not important is also another critical skill of being mentally fit.
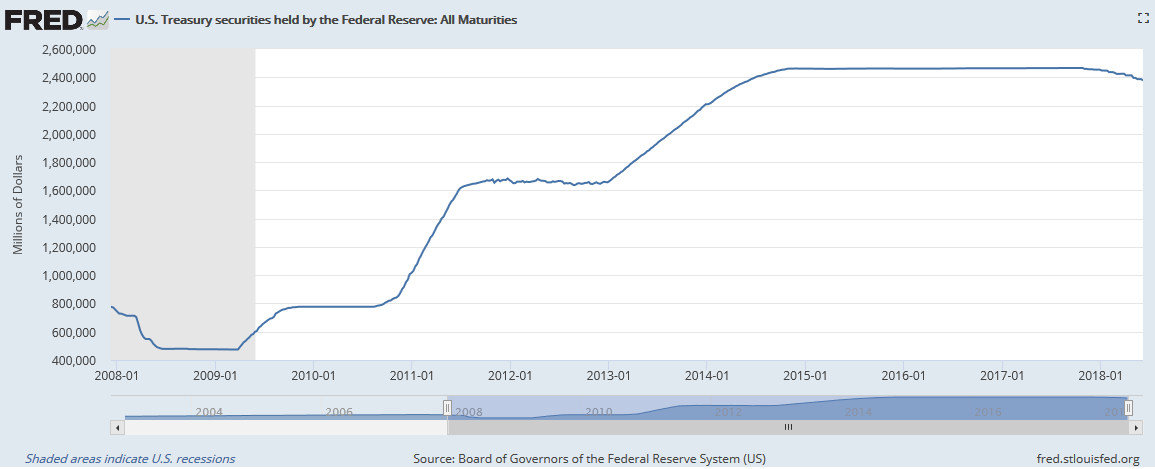
As an example, a conspiracy theory investor that claims that the Federal Reserve is turning the US Dollar into toilet paper and advocating gold will go to US$5,000/Oz in a year is not likely demonstrating a mastery of certain aspects of mental fitness. It should be pointed out, however, that people who are mentally unfit for investing will occasionally be right, but just for the wrong reasons – this is known to be “getting lucky”, or being right for the wrong reasons.
So who do you want managing your money? Presumably somebody that has a high degree of mental fitness.
The problem is that aside from looking at their track record, it is not easy to determine whether the person demonstrates capabilities of being mentally fit – they could have gotten lucky for many years. Reading letters to investors and examining other such soft information gives one insight on the thought processes of investors. Most people in finance read Buffett’s letters and know the type of person that they are placing their faith in. Likewise, anybody reading and listening to Thomas Peterffy, the CEO of Interactive Brokers, will know he is a genius. Prem Watsa of Fairfax is another. All of these people have very long-term track records and it is pretty clear what information they do transmit to the public is just the tip of the iceberg in relation to their overall mental capabilities. Until they get old enough where dementia and other mental afflictions impair their investment capability (particularly in the case of Buffett and Munger who are above the average life expectancy), it can be reasonably inferred that their above-average performance will continue.
But for the rest of the mere mortals in the investing industry, there usually isn’t enough real data to analyze to determine mental fitness beyond the track record. I will claim the track record alone is not a sufficient indicator of financial mental fitness.
I will also claim that mental fitness is greatly assisted by physical fitness, and physical fitness is greatly assisted by mental fitness (and indeed, both of them are correlated and cause each other to occur).
One aspect of physical fitness is that it can be objectively measured. While society looks for quick fixes for everything (fad diets, cosmetic surgery, instant on-demand entertainment, etc.), physical fitness is something that cannot be easily bought or accomplished without actually putting in the individual work and effort to do so. It is also easy to measure – you can swim 100 meters in a certain time, you can run a distance at a certain time, or you can keep your heart rate above a certain rate for a certain length of time, or you weigh so-and-so given your height and gender. All of these physical fitness parameters have result-oriented endpoints that make it easy to measure performance.
Getting to a physical fitness goal means that one has to engage in a process to get there, which requires plenty of mental discipline. Realistic physical fitness goals require a lengthy period of time to achieve – well beyond the “January 1st new year’s resolution to get fit” that a lot of people engage in without a proper plan and the proper mental discipline to execute on a long-term physical fitness program.
There is no way that I can run 10km in 55 minutes without consistently training and applying both mental and physical discipline to doing so throughout the course of a year. If I apply even more discipline and stop eating body-inflating carbohydrates and indulging in foods that I obviously know are not the best for me, I can shave off even more time in my next year’s measured performance. It is not an all-or-nothing proposition – it comes in small, incremental steps. Physical fitness also cannot be faked. Mental discipline is much more difficult to measure in such small increments.
Plenty of psychological literature suggests that exercising will improve mental health.
There is an amplifying positive feedback loop – in order to increase physical fitness, you need the mental fitness to give you the discipline to improve physical fitness. You can get that mental fitness by increasing your physical fitness.
So for anybody that is interested in improving their financial performance without wanting to read any of the academic theory behind financial statements, valuations and trading patterns (all of which would be very helpful), I would recommend they start by improving their physical fitness as a route to building on mental fitness.