Markets bounce back on boxing day

I will offer some commentary about today’s market action. I wasn’t expecting to write this so soon.

Back on December 20 (which was less than a week ago!), I wrote the following:

My gut feeling suggests that we need to see more of a washout. We are likely to see a huge market rally at some point in the near future (you’ll see the S&P 500 jump up 5% over the course of a few days), and this will simply punctuate the next part of the downtrend – recall that the biggest rallies occur in these down trending markets. It is exactly designed to coax non-committed capital into the marketplace under a false pretense.

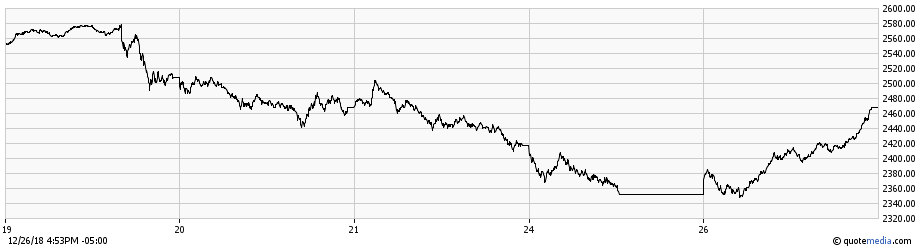
When closing the part day on Christmas Eve, the S&P 500 powered down over 2% and given what has happened during the month of December, I do not think traders wanted any risk positions exposed during Christmas.

Now we’ve got our market rally. It’s happening right now, all in a day. There will be a week or two of more positive market action. We will get a partial recovery and institutions and investors will feel more comfortable again. We are going to hear headlines such as “the economy is fundamentally in great shape”, and “unemployment is low”, and “America is still the economic engine”, etc, etc., but all of this is going to be a complete smokescreen.

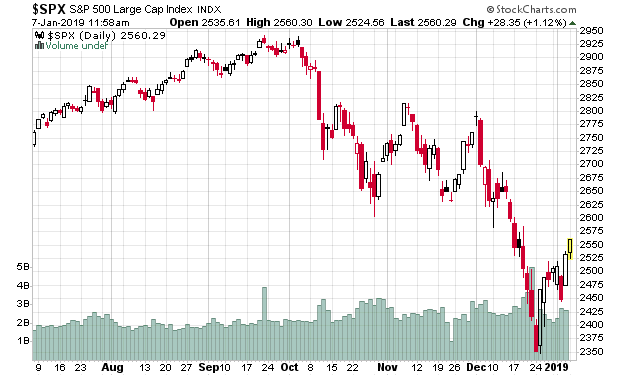
Now that the mini-break period is over, today we saw the S&P 500 rocket up nearly 5%. The TSX is closed for Boxing Day, but it is very likely to trade up on Thursday as a result. It will get sold after the morning – when this will start, I don’t know.

In bear markets, the rallies are the swiftest and the most punishing for short sellers. There are a few reasons for this. Rationally, you have some balancing re-allocation from fixed income to equity from portfolio managers that keep fixed allocations of asset classes. The more emotional component is that money flows back into the market to avoid missing out on the bottom (the so-called “buying opportunity of the year”). For the past decade, participants have been conditioned to believe the the markets will bounce back. We saw this in August 2011, October 2014, February 2016 and even as recent as this Spring, where markets took a 10% dip and recovered to all-time highs.

I will claim things are different. What is different this time? The state of monetary policy. I have written about this in detail in previous posts.

Keep solvent. Cash is always a valuable commodity, but especially during these times. Preparing to watch out for forced and spontaneous liquidations will be the best way to make money in 2019, not by index investing. Indeed, those with the buy-and-hold mantra will have their nerves continually tested in 2019 – how much bleeding can they take before they will cash themselves out?

Investing is never easy, nor will it ever be. Looking at the retail side of things, firms that make ETF investing and robo-investing sound easy as opening an account, funding it, and choosing some mix of ETFs make the financial markets look like automated cash machines. Now these same people are realizing that there is indeed a flip side to the proposition – markets can also go down.

Christmas Market Meltdown

First of all, Merry Christmas to my readers. Even if your financial health is suffering due to this very exciting quarter, be thankful if your physical health is in good stead. I won’t blame you if your mental health is somewhat suffering simply due to all of this calamity going on.

My “stock radar” is coming up with so much material to look at right now that, coupled with the other usual obligations that go along with the Christmas season, I am running out of time to properly look at everything.

I’m going to summarize a lot of information in this post and it will be in no particular order.

S&P Volatility

Volatility is anti-correlated to the price index and past history would suggest that if this index reaches to around 50-60 it would probably be a good time to deploy capital. This happened last in early February, but going back in time, the previous opportunity was the Euro-crisis in the Summer of 2015.

S&P 500 itself

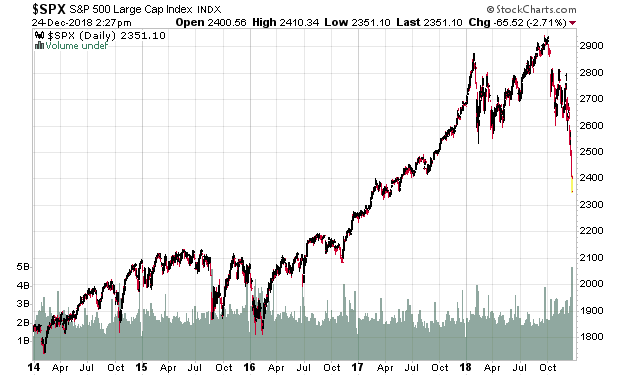
Technical analysts will point to a very obvious price target – around 2,100. If this happens, that equates to nearly a 30% plunge in the S&P 500. From a high of 2940.91 (September 21, 2018) to 2351 today, the index has dropped 20%. The big factor is that this has happened in a very short period of time – about 3 months.

TSX

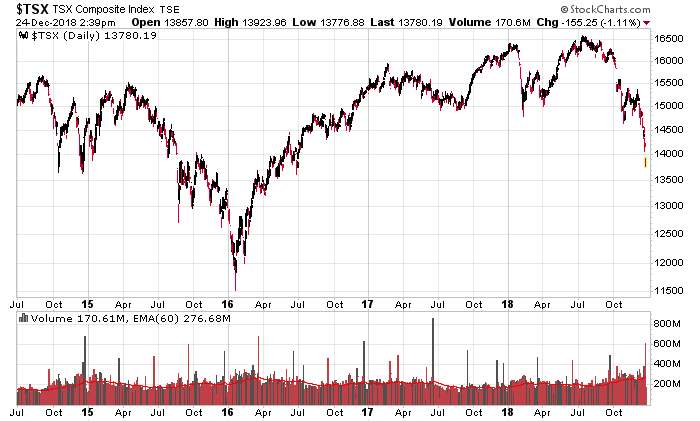
The longer-term chart for the TSX doesn’t look nearly as bad simply because the commodity-heavy capitalization of the index never took off in the first place. Despite appearances, the high was 16,586.50 on July 13, 2018 and at today’s value of 13,780, that’s a 17% drop, so mirroring pretty much the same that happened to the US major index. There’s still another 15% or so from present prices before getting to the commodity plunge pricing in February 2016.

Oil and Production

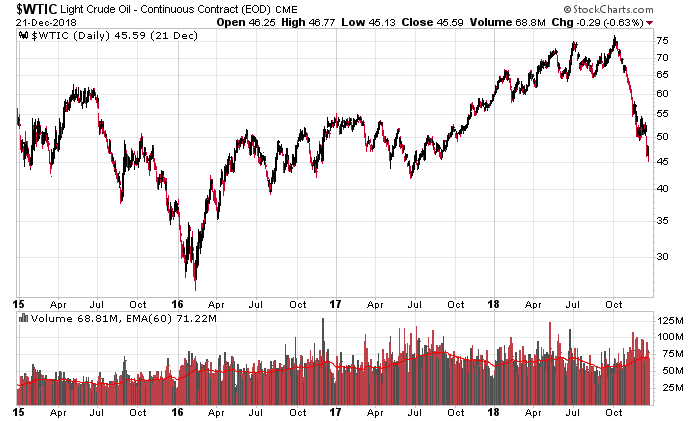
US producers have crushed everybody else into oblivion. Coupled with an economic slowdown, there is going to be a lot more financial pain in oil markets if pricing does not improve. The commodity price is getting to the point where it is nearing the marginal cost of extraction at the volumes of crude required, but a longer term analysis of commodity trends says that prices can actually go below marginal extraction costs for quite some period of time before normalizing. Just look at the Uranium market as a good example.

Western Canadian select is around US$30, which is a healthy recovery from the dark November days when they traded as low as US$12. The differential has narrowed to US$15/barrel, but this was probably not what they wanted – there isn’t a lot of profitability in Canadian oil at US$30/barrel.

If we are going into a recession and consumption does decline, we are still going to see further pain in oil and gas. That said, a lot of oil and gas stocks, especially Canadian producers, are trading like the businesses are going to go bankrupt. At current prices, some will be, but successful timing of the commodity cycle and maximum pessimism should be rewarded with handsome capital gains. Getting this timing correct is never easy.

Safety of various well-known issuers

Many people out there, especially on the retail side of things, are looking at major Canadian banks (BNS, BMO, etc.) and high-yielding utilities (e.g. Enbridge) as bargains at present. While they sport high dividend yields, they also sport liquidity risk that I do not believe these investors fully appreciate.

A good metric for how dangerous these companies truly are is represented in the junk bond market (e.g. HYG:US) is a reasonable proxy for the junk bond market.

If BBB credits (and worse) can’t get good debt financing, then most other debt-sensitive sectors are going to face higher refinancing costs. Leveraged entities are going to face earnings reductions.

Canadian Convertible Debenture sweep

I’ve done a sweep of the entire TSX exchange-traded debt market. Only two issuers really caught my attention out of the entire universe that is trading. I’ll be doing some more research on it later.

Some other gems that I will mention in the TSX exchange-traded debt space: the fiasco at Zargon, and you can always pick up some debentures of Lanesborough (TSX: LRT.DB.G) for less than a penny on the dollar if you believe Fort McMurray real estate is going to make a swift comeback from the dead. This REIT is so deep into the hole, the only question is how the present controlling management will be able to siphon any value out of it before they pull the CCAA pin and euthanize the publicly trading entity.

In general, I’m surprised how little value there is in this space given the calamity going on in the equity side.

Short-term cash management

US Dollar:
Little duration risk –
BSCJ earning 3.18% (minus MER 10bps), 0.5 year duration
IBDK earning 3.16% (minus MER 10bps), 0.46 year duration

Both these ETFs terminate at the end of 2019 and contain mostly Baa-A corporate debt scheduled to mature in 2019. Duration risk will drop as their bond portfolios mature (good for a rising rate environment, although one suspects it won’t be rising for too much longer!).

Some more duration risk can be had with SHY, 1.88 years, with a 2.65% YTM, and 15bps MER.

Interactive Brokers gives 1.9% on USD, so one takes about a 1.2% pre-tax sacrifice for holding it vs. a near brain-dead bond fund.

Canadian Dollar:
RQG earning 2.54% (minus MER 28bps), 0.65 year duration
XSB earns 2.45% (minus MER 17bps), 2.75 year duration, slightly safer bond selection than RQG.

Interactive Brokers gives 0.71% on CAD, so the spread is about 1.5-1.6% pre-tax.

Home Capital Group and Equitable Bank’s short-term savings accounts give a 230bps yield for on-demand money, so if one is willing to do the paperwork hassle and is willing to take some deposit risk (remember the imminent solvency worries about Home Capital Group earlier this year?), this is not a bad place to park capital in relation to having to suffer through the hassles of trading the above. Indeed, if you feel brave and want to lock in for a year, they will offer 310bps.

Considering the Government of Canada 3-month rate is 1.67% and 5-year rate is 1.92%, this is telling. The competition for deposits is likely to increase and this would explain why banks are not going to do so well in the future.

Canadian / US interest rate environment

BAX quotations have flat-lined. The current 3-month Bankers’ Acceptance rates are 2.23%, and with the March 2019 BAX futures trading at 2.26%, the market is now projecting that Poloz will hold steady on his January 9, 2019 rate announcement. I’m somewhat thinking that the demise of at least one future rate increase is mis-guided, but we will see.

The US interest rate environment has changed dramatically over the past couple weeks. Now the Federal Funds rates are locked at 97.60 (2.4%) through December 2019, plus or minus a very minor chance of one rate increase. The two-year treasury bill yield is down to 2.63%, and the 10-year is at 2.75% – very slim differential.

Future market projections and where to make outsized returns in the future

Am I going to give away all my financial secrets for free? Sorry!

But needless to say, I think there are a few areas with very low-lying fruit that is getting sold off in forced-liquidation type trading. Figuring out when there will be a bounce-back will be difficult. This isn’t a 2016-type environment where you have the federal reserve willing to throw hundreds of billions of dollars into the market – we are facing the opposite environment and thus must act accordingly.

I’ll have my year-end update posted sometime near the new year. Barring a significant market event, Q4-2018 will be my first quarterly loss since September 2015!

Quick market update

The Federal Reserve has raised interest rates another 0.25% to 2.25% to 2.5% with the target being 2.4%. This is a change from 2.00% to 2.25% with a 2.2% target rate.

Also, the quantitative tightening will not be tightened further – the amount of treasuries in the Fed’s balance sheet will continue to reduce by $30 billion and mortgage backed securities by $20 billion monthly. Previously the Federal Reverse increased the reductions quarterly.

So there is obviously an inflection point on the rise in interest rates and the quantitative tightening. According to FRED data, the level of treasuries held by the Fed will still be above 2012-2013 levels before they engaged in another round of quantitative easing.

Using the “hand in the vice” analogy, the vice is being tightened, but now at the same constant rate instead of the rate going faster. It will still result in some bones being crushed. We are easily seeing who some victims are (typically entities reliant on debt renewals – money is getting tighter). Junk bonds are going to be no escape.

Canadian interest rates typically have kept in “lock-step” with US interest rates and I would expect to see another quarter point increase on January 9th. I wouldn’t expect the Federal Reserve to act again on rates until their May 1st meeting unless if the stock market crashes or normalizes.

Market volatility has really increased since the beginning of October and one observation is that I am really surprised how much the fixed income component of my portfolio (specifically preferred shares) has depreciated during that time period. 5-year government bond yields have dived over 50 basis points over the past couple months, which is not good if you have rate reset shares coming up.

I have been researching companies like crazy at this period of time since a lot has been hitting my radar. You outperform the market by investing at panic bottoms.

My gut feeling suggests that we need to see more of a washout. We are likely to see a huge market rally at some point in the near future (you’ll see the S&P 500 jump up 5% over the course of a few days), and this will simply punctuate the next part of the downtrend – recall that the biggest rallies occur in these down trending markets. It is exactly designed to coax non-committed capital into the marketplace under a false pretense.

My liquidity position is excellent to take advantage. I’ve been waiting for this opportunity for some time. I am in no rush at the present moment to get in – it’s too early. More pain needs to be felt by the marketplace.

Canadian preferred share indexes hammered

The Canadian 5-year government bond rate has compressed significantly:

As most Canadian preferred shares are linked to this rate, we are seeing a huge selloff (which interestingly took place about a month before 5-year interest rates really started to drop):

ZPR is a BMO ETF tracking preferred shares. CPD is an ETF tracking a preferred share index holding most of the investment grade preferred shares trading on the TSX (mostly concentrated in Financials and Energy). Holders in these “safe” funds will have had around 13-14% of their capital value evaporate over the past two months of trading.

It is indeed ironic how the equity components of the preferred share indexes have fared generally better – as an example, Toronto-Dominion equity has declined about 10% in the same period of time.

So much for preferred shares being a safer vehicle to invest in!

The big difference this time around is that a lot of the rate-reset preferred shares have already had their yields reduced to a minimum due to the 5-year Canadian bond rate being so low for an extended period of time. Subsequent rate rises will have less impact on the dividend rates paid for preferred shares.

It remains to be seen whether this will continue or not. Back in February 2016, we had seen double-digit dividend yields on very credit-worthy issuers, but this was also when the 5-year bond rate was trading at around 100 basis points.

I’ve also been doing some research on preferred shares that are not held by these two funds. I would suspect that less liquid preferred share series on the main two ETF indexes would be more prone to auto-selloff algorithms when people inevitably decide to panic and try to liquidate everything.

Very often, people hold cash in their portfolios for too long and then get itchy. They then instead think of investing in “safe” preferred shares, or an index, thinking that the 5-6% yield they realize is adequate compensation for the risk in lieu of holding cash.

It is these situations where they rethink this notion and decide to liquidate. Eventually the capital losses become too much to bear.

It is very difficult to time when the maximum moment of panic is, but doing so will result in outsized risk/reward ratios, which is why I’ve been paying careful attention in these very volatile couple months.

Doing a portfolio check on a heavy down day

As I write this the S&P 500 is down over 3% for the day. The TSX is down 1.4% which isn’t so bad by comparison.

An index is simply a collection of stocks. For the two indexes above, companies that have higher market capitalization are weighted high in the index. When an index gets sold off heavily, there is a high probability that the higher capitalization stocks in the index will also be sold off.

When there is heavy market volatility it is usually wise to look at what is going down by the averages, what is going down more than the average and which stocks are holding steady or even rising, especially those stocks that are not included in a major index. It gives you some hints as to which sectors are and are not popular for the day.

Institutional investors are usually required to keep specific ranges of portfolio fractions (i.e. an allocation between equities, bonds and other asset classes). Typically when broad equities drop, managers will dump bonds in order to buy equities to rebalance the portfolio.

Today, contrary to what the market has been doing a few months ago, a selloff in equities is once again correlated to an increase in risk-free bond securities – I note that the 10-year treasury bond yield is down some 70 basis points – which means that what we are seeing in the markets today is a flight to less risky positions. The yield curve continues to flatten – there is a 10 basis point difference between 2-year and 10-year treasuries now.

If equities fall enough, collateral values will also decline to the point where portfolio managers will have to liquidate assets in order to maintain sufficient collateral – i.e. a margin call situation. If enough of this happens, you will start to see significant opportunities appearing on the equity side.

It’s more probable than not that the upcoming December meeting of the Federal Reserve will be the last quarter point interest rate hike before they take an extended pause. If interest rates stop rising, then the next market focus will be back for finding yield.

Another observation is that gold is doing reasonably well. It is a shame for most investors that most gold mining companies are poorly managed.

I’ve still got a lot of dry powder in the portfolio and I’m waiting for worse times. There will be a time to pounce but not yet.

There is one other observation I will make – robo-investing and index investors that choose allocations of various low-cost ETFs are dooming themselves to sub-par returns. Every time I hear people investing in whatever index fund that pledges market diversity (e.g. VGRO is quite popular) I just think to myself if they are truly prepared to earn low single digit returns with the real risk of them seeing 25% peak-to-trough downdrafts.

It was about 10 years ago when the economic crisis was clearly in full swing – Bear Stearns went bust, Lehman Brothers went bust, and anything financial was imploding. The S&P 500 was still at around 870 at this time. It wasn’t for another 3 months before the S&P 500 reached its low (the value being “666” appropriately enough) – you would have still seen a 23% decline in value.

This time around, how much of a value loss can index investors take before the perception of an unlimited wealth creation vehicle evaporates? Today, we are at 8% below the peak of the S&P 500. Canadian investors (via the TSX) have seen a 9% drop from peak-to-trough in the index high.

“This is just another buying opportunity to buy shares cheaply”. Or is it?

As my last note, I will point out that General Electric (NYSE: GE) is down 6.66% today. How symbolic.