Below are 29 companies that are trading lower than 40% year to date on the TSX, that have a market cap of above $75 million. I’ve also restricted the share price to greater than 50 cents.
TSX tax loss candidates
August 30, 2019 closing pricesLast trade > $0.50
Market Cap > $75 million
YTD change -40% or worse
| Item | Symbol | Name | Sector | Last | YTD %Chg | MktCap ($M) |
|---|---|---|---|---|---|---|
| 1 | TH-T | Theratechnologies | Bio | 4.98 | -40.14 | 394 |
| 2 | AVCN-T | Avicanna Inc | Cannibis | 3.66 | -41.25 | 88 |
| 3 | IDG-T | Indigo Books & Music Inc | Retail | 6.6 | -41.49 | 180 |
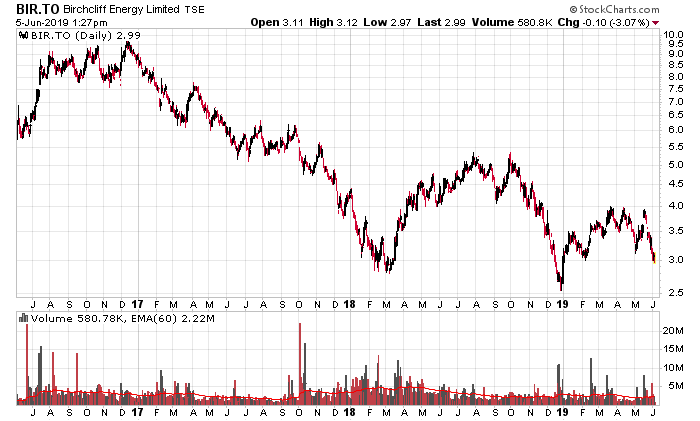
| 4 | BIR-T | Birchcliff Energy Ltd | Energy | 1.77 | -41.78 | 503 |
| 5 | SOY-T | Sunopta Inc | Food | 3.07 | -41.86 | 275 |
| 6 | SOX-T | Stuart Olson Inc | Engineering | 2.89 | -41.97 | 82 |
| 7 | ATH-T | Athabasca Oil Corp | Energy | 0.57 | -42.42 | 303 |
| 8 | ADVZ-T | Advanz Pharma Corp | Bio | 14.7 | -42.93 | 673 |
| 9 | CFX-T | Canfor Pulp Products Inc | Forestry | 9.08 | -43.99 | 574 |
| 10 | UNS-T | Uni Select Inc | Auto | 10.79 | -44.41 | 456 |
| 11 | MDF-T | Mediagrif Interac | IT | 5.23 | -45.29 | 81 |
| 12 | MPVD-T | Mountain Province Diamonds | Diamonds | 1.04 | -46.67 | 223 |
| 13 | HNL-T | Horizon North Logistics Inc | Energy Service | 0.95 | -47.22 | 155 |
| 14 | IMV-T | Immunovaccine Inc | Bio | 3.58 | -47.89 | 186 |
| 15 | DII-B-T | Dorel Industries Inc Cl.B Sv | Retail Wholesale | 9.1 | -48.41 | 292 |
| 16 | LGO-T | Largo Resources Ltd | Metals | 1.37 | -51.59 | 728 |
| 17 | PONY-T | Painted Pony Energy Ltd | Energy | 0.68 | -54.36 | 114 |
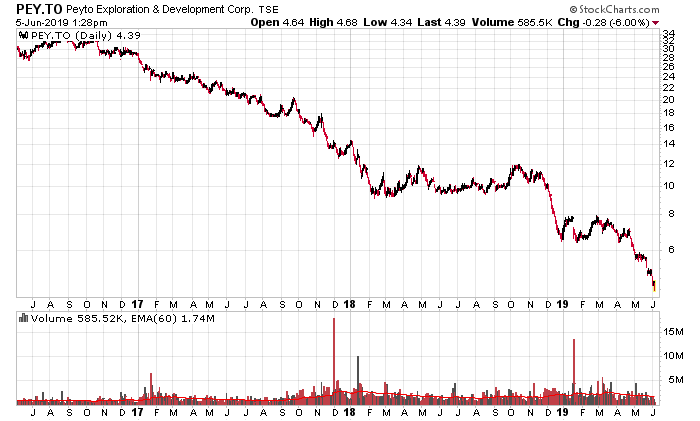
| 18 | PEY-T | Peyto Exploration | Energy | 3.2 | -54.8 | 554 |
| 19 | BNP-T | Bonavista Energy Corp | Energy | 0.54 | -55 | 149 |
| 20 | DR-T | Medical Facilities Corp | Hospitals | 6.74 | -55.19 | 211 |
| 21 | NVA-T | Nuvista Energy Ltd | Energy | 1.61 | -60.54 | 370 |
| 22 | MAV-T | Mav Beauty Brands Inc | Beauty | 4.11 | -61.52 | 155 |
| 23 | SNC-T | Snc-Lavalin Sv | Engineering | 16.41 | -64.26 | 2,858 |
| 24 | OBE-T | Obsidian Energy Ltd | Energy | 1.27 | -64.43 | 97 |
| 25 | TRST-T | Canntrust Holdings Inc | Cannibis | 2.3 | -64.99 | 335 |
| 26 | JE-T | Just Energy Group Inc | Energy Retail | 1.46 | -67.63 | 227 |
| 27 | TRQ-T | Turquoise Hill Resources Ltd | Metals | 0.58 | -74.22 | 1,187 |
| 28 | ZENA-T | Zenabis Global Inc. | Cannibis | 1.06 | -82.33 | 214 |
| 29 | PLI-T | Prometic Life Sciences Inc | Bio | 11.6 | -95.54 | 280 |
Comments:
1: A bio company with an FDA approved small scale HIV medication (used in cases where mainline HIV treatments do not work), and a new product that is used for something called hard belly – which is a symptom in some long-term HIV patients as a side effect of the anti-retroviral drugs that they take to keep viral loads down. Stock is down because sales aren’t exactly going anywhere and those sales and marketing expenses are indeed quite high. Market cap is trading as if the company will get sold off (drug companies don’t capitalize their R&D expenses it takes to get a drug to market, so there is a bunch of hidden balance sheet value in the drugs, despite the relatively little revenues they get from them).
2, 25, 28: Are Marijuana companies, and I have no interest in analyzing them.
3: Indigo is a typical retail story. Their stock chart in the past 18 months is a straight line down. Aside from their lease commitments, their balance sheet isn’t in terrible shape and management has some time to decide what to do, but they are bleeding money at a frightening pace.
4, 7, 13, 17, 18, 19, 21, 24: Canadian oil/gas extraction companies, so I do not need to write further why they are trading down. 13 is an energy service company. My big surprise here is why there aren’t more companies on the down 40% list (doing some quick investigation, it is because most of them already got hammered in 2018 so the losses in 2019 relatively speaking isn’t as big).
5: A low margin food producer with a ton of debt on the balance sheet and bleeding cash. Not looking pretty.
6: Engineering firm impacted somewhat by oil and gas-related spending. Income statement shows they are treading water. They were able to raise financing from Canso at 7% for unsecured debt (rolling over an existing debt issue) and the balance sheet is not in terrible shape. May be a good possibility for a turnaround – given its market cap of $80 million in relation to its overall size (revenues will be roughly a billion in 2019), something to watch. Has a similar feel to IBI Group.
8: The old Concordia Pharma. Classic case of what happens when you over-leverage cash flows too much. They make a ton of cash, but they have a ton of debt and a ton of interest expenses.
9: Lumber has been killed for various reasons. Despite being from British Columbia, I should know more about the industry. Just a year ago it was trading at $27 and today it is nearly $9. The stock graph looks like a normal distribution curve. Despite the fact that their cash flows has been decimated year-to-year, they don’t have any debt and look like they can survive the cycle. Jimmy Pattison trying to take over Canfor Corporation (not the pulp subsidiary) for $16/share seems to be a case of trying to take them on the lows. Canfor owns 55% of Canfor Pulp.
10: I know less about automobile companies than forestry products. Skimming the financial statements, they just appear to be losing profitability and racking up debt.
11: A small IT firm that is undergoing a strategic change and also still looking for a new CEO. Still profitable, and with a relatively blank canvas balance sheet.
12: Owners of a 49% interest in a diamond mine in the N.W.T., and barely making enough to pay off their bank lenders. Will pass.
14: Early clinical stage biotech working on some cancer therapies, P2 studies have samples of less than 20 patients, and skimming the science, looks questionable.
15: Legitimate larger company that has been in a slow straight-line descent for the past three years. Three major product lines (babies, sports and furniture) are sold to major retailers worldwide. Management (Schwartz – family-controlled dual-stock corporation) has been around for a very long time, albeit they seem to be highly overpaid. They resolved an upcoming debt maturity last June with a 7.5% unsecured debt note (not convertible) and this will buy them time to figure out how to improve margins. Cash flows from operations have been diminishing, and they already once cut their dividend, and it is due for another cut. However, given the ~$300 market cap and $2.5 billion in revenues, the potential for a turnaround here is reasonably good, except for this looming worldwide recession coming which would surely impact this company’s fortunes!
16: They mine a commodity I know nothing about (Vanadium), in a country I know very little about (Brazil).
20: This one is interesting. A company that owns majority or near-majority stakes in a few hospitals in the USA and distributes most of its free cash. The only problem being that in the past few quarters, they have really underperformed. If they can figure out what they did wrong and reverse it, then the stock is an easy double from their depressed price. It was bond-like until the bottom fell out of it in the May and August quarterly reports. If there was a candidate for year-end tax loss selling, this one would be it. Another interesting quirk is that their distribution rate on a historical basis is now at a 17% yield. This distribution was below their cash generation in prior years, but not from the first half of this year. It’s likely they’ll cut this dividend unless if they think the past couple quarters was temporary. Knowing about the US healthcare industry, especially in the states that DR operates in, coupled with competitive dynamics of healthcare and competitors will help.
22: Cosmetics company that went public in July 2018 for CAD$14/share (proceeds to pay down debt with IPO). Now it is trading at $4.11/share, which is a fairly good 70% negative return on investment. The company is now barely profitable, but still isn’t at the level which supports the debt on its balance sheet. Still, cosmetics is a pretty high leverage industry to be in if your revenues start to take traction – and their revenues are growing. Might be interesting, considering that beauty products sell in any economic climate! Unfortunately, you won’t see me wearing any…
23: SNC. Enough said. There’s tons of industry analysts out there looking at this one. Their partial sale of the 407 freeway around Toronto will buy them a lot of time to get their act together, but in the meantime, their operations are a total mess. There will probably be a time to buy this one but it will take awhile, and likely more corruption from the federal government is required for a positive outcome (i.e. if Trudeau gets re-elected, it would be a positive for SNC for sure).
26: Balance sheet is a train wreck, company is exploring a recapitalization, and the business model itself is highly broken. Good luck!
27: Another mining company working in a jurisdiction I know hardly anything about (Mongolia), let alone I can’t even pronounce the name of its main flagship mine. Don’t have any more insight than that, sadly.
28: The big loser in the TSX is due to a debt-to-equity recapitalization and a 1:1000 reverse stock split. After the recap they did get rid of a bunch of debt on the balance sheet and raised some cash, which they need in order to bide their time to get FDA approval for their lead product. They burnt about $50 million cash in the first half of the year and have about $80 million left on the balance sheet, so looks like they’ll have to raise more financing…