Cenovus / Sunrise Oil Sand Acquisition – Analysis

Cenovus (TSX: CVE) today announced they are purchasing the remaining 50% interest in the Sunrise oil sands assets for C$600 million plus another C$600 million in contingent consideration, plus a 35% interest in the “Bay du Nord” project in Quebec, a currently undeveloped offshore project.

The contingent consideration is quarterly payments of $2.8 million for every dollar that Western Canadian Select is above CAD$52/barrel, for up to 2 years, and a maximum of C$600 million. Considering that WCS is currently at about CAD$130, this will work out to $220 a quarter. Barring a complete disaster in the oil sands, it is a virtual certainty the entire C$600 million will get paid out.

I have no idea how to value the 35% Bay du Nord project stake and will zero this out for the purposes of the following calculations.

Cenovus made a $56.20 netback in their Q1-2022 oil sands productions. Sunrise, not being the best asset on the planet, is about $15/barrel more expensive to operate and transport, so we will calculate a $41/barrel netback. However, the royalty structure is in pre-payout, compared to post-payout and hence netback will be higher by about $10/barrel. Very crudely (pun intended!) I estimate around $51 netback (estimated to last 7-8 years before the full post-payout rate kicks in). CVE will acquire 25k boe/d, so they are acquiring about $465 million of netback with $1.2 billion spent, or about a 39% return.

This does not assume that CVE will be able to scale up the operation to 60k boe/d as stated in the release, which would add another $186 million/year, or about 15% extra, ignoring the incremental capital costs of the project.

Tax-wise, CVE still has a $17.6 billion shield at the end of 2021, so the impact of income taxes will not kick in for at least a couple years. Even assuming full income taxes and ignoring the extra 10kboe/d production, CVE is purchasing something for a 30% after-tax return in today’s commodity environment. That’s pretty good for shareholders!

How to hedge against hedges

An annoyance of mine in the oil and gas space is the action of management hedging against changes in commodity prices. They engage in this activity for various reasons. A valid reason is if there is a financial threat that would be caused by an adverse price move (e.g. blowing a financial covenant is something to be avoided). A not-so-valid reason is “because we have done so historically and will continue to do so”. An even less valid reason is “I’m gambling!” – that’s my job, the job of the oil and gas producer is to figure out the best way to pull it out of the ground!

One additional problem with hedging is that you will get ripped off by Goldman Sachs and the like when they place positions. Your order will always be used against you. There are always frictional expenses to getting what is effectively a high cost insurance policy.

Such policies look great in a dropping commodity environment, but in a rising environment they consume a ton of opportunity cost to maintain. For example, in the second half of last decade, Pengrowth Energy managed to stave off its own demise a year later than it otherwise should have because it executed on some very well-timed hedges before the price of oil collapsed. Incidentally, the CEO of Pengrowth back then is the CEO today of MEG Energy (TSX: MEG).

MEG Energy notably gutted its hedging program after 2021 concluded. They lost $657 million on that year’s hedging program, just over $2/share.

Let’s take another example, Cenovus Energy. I have consistently not been a fan of Cenovus Energy’s hedging policies, especially since it is abundantly clear that they will have been able to execute on their deleveraging. In their Q4-2021 annual report, digging into their financial statements, you have the following hedges:

For those needing help on their math, if you ignore the minor price differential between the buy and sell, it is approximately 66,666 barrels per day that is pre-sold at US$72, up until June 2023.

As I write this, spot oil is US$103. That’s about $1.1 billion down the tubes.

So today, Cenovus fessed up and said they’ve blown a gigantic amount of money on this very expensive insurance policy:

Realized losses on all risk management positions for the three months ending March 31, 2022 are expected to be about $970 million. Actual realizations for the first quarter of 2022 will be reported with Cenovus’s first-quarter results. Based on forward prices as of March 31, 2022, estimated realized losses on all risk management positions for the three months ending June 30, 2022 are currently expected to be about $410 million. Actual gains or losses resulting from these positions will depend on market prices or rates, as applicable, at the time each such position is settled. Cenovus plans to close the bulk of its outstanding crude oil price risk management positions related to WTI over the next two months and expects to have no significant financial exposure to these positions beyond the second quarter of 2022.

As this hedging information was already visible, the amount of loss can be reasonably calculated, so the actual loss itself isn’t much of a surprise to the market. The forward information is they’re reversing the program.

However, even if they did not, an investor can still reverse their decision in their own portfolio, using exactly the same West Texas Intermediate crude oil contracts that Goldman and the like will use. As an investor, you can take control in your own hands the level of hedging that an oil/gas producer takes.

For instance, using the above example, it works out to 2 million barrels of oil a month (net of sales and purchases) that is being hedged. Note each futures contract is good for 1,000 barrels of oil.

If you owned 100% of Cenovus Energy, you could sell 2,000 contracts of each month between the January 2022 to June 2023 WTI complex. Obviously you wouldn’t want to hammer such a size in a two second market order, but there is enough liquidity to reasonably execute the trade.

I don’t own 100% of Cenovus, but the same principle applies whether you own 10%, 1%, or whatever fractional holding of the company – you just reduce the proportion of the hedge.

The only impractical issue to this method is the 1,000 barrel size per futures contract sets a hefty minimum. You need institutional size in this particular case. For instance, just one futures contract sold across January 2022 to June 2023 would correlate with the ownership of approximately 1,000,000 shares of Cenovus Energy. Anything more than this and it would be positive speculation on the oil price (which is what one implicitly does when investing in such companies to begin with!).

The same principle applies for companies that do not employ the desired amount of leverage (debt to equity) in their operation. Assuming your cost of financing is the same as the company (this factors in interest, taxes, covenants, etc.), there is no theoretical difference between the company taking out debt versus you buying shares of the company on margin to achieve the desired financial leverage ratio.

Going to back to crude oil, deciding to un-hedge only works when you assume there is a rising commodity price environment. Management’s actions, no matter which ones they take, are implicitly a form of speculation on future prices and if you disagree – if for whatever reason you don’t want to sell the company outright (e.g. continuing to defer an unrealized capital gain) you can always hedge yourself by going short those crude futures. The power is always in your hands as an investor!

The power of reinvestment and compounding returns

This post should not be news for anybody in finance, but it is worth refreshing fundamental principles of compounding and equity.

The most attractive feature of equities vs. debt is the effect of compounding. Stocks can rise infinitely while bonds have an effective price cap at the risk-free rate of interest.

To get on the equity gravy train and make outstanding returns, you need to have capital invested in a business with great prospects for reinvestment.

We will use an example of a debt-free company earning a perpetual $10 per year on a $100 investment, but the investment is of a style that does not scale upwards with further reinvestment. The long-term risk-free rate of interest is 2%. Our dream world also does not have income taxes or management expenses.

In this instance, the company can choose the following policies (or a blend thereof):
1) Give the money back to shareholders.
2) Bank its cash and receive 2% on that capital,
3) Speculate on other (preemptively higher-yielding) ventures.

If the policy option is (1) then in theory the valuation of this firm will be $500 (the risk-free rate of interest). The company will still generate $10/year for its shareholders whether the valuation is $100 or $500. An investor would be indifferent to sell the business for $500 and invest in the risk-free bond or just keep holding onto the business – you have magically created $400 of capital profit and you can clip dividends or bond coupons. With your $10/year you can do what you please, or put it in a risk-free 2% yourself.

This example is a constraint of reinvestment – after the re-valuation, your equity has effectively turned into a bond with no chance of compounding beyond the risk-free rate of interest.

If the policy option is (2) then you will see your returns in the appreciation of equity value. After the first year, your firm will generate $0.20 more in income and this will translate into $10 extra equity value, and this will compound at the rate of 2%.

Policy option (3) introduces the concept of risk – can management pull off the reinvestment? If there was an attractive investment at 5%, they would be able to generate $0.50 extra and this would translate into $50 of extra equity value for its holders, again, capitalized at the 2% risk-free rate.

So far we have made the assumption that the equity value follows lock-step with the risk-free rate of return. Of course in the real world, it never works that way and there are wildly divergent capitalization percentages used.

What is interesting is in this fictional example, the results you get if the initial equity investment does not trade at the risk-free return rate, but rather it trades at a higher rate, say 5%.

In this instance, the company would trade at an equity value of $200.

We will then consider a fourth policy option with the generated cash returns:
4) Buy back your own stock

This option requires a willing seller to the company (something that isn’t available to a 100% wholly owned firm!). Passing that assumption, an incremental deployment of $10 into the company’s own stock (a 5% reduction in shares) would result in continuing shareholders receiving 5.3% more returns in the future. Shareholders as an aggregate will still receive $10/share in returns, but the return per share will be 5.3% higher than before due to the reduced shares outstanding. This is a far better outcome than policy option (2).

The principle is the following: If a company is earning sustainable, long-lasting cash flows, it is to the benefit of shareholders that either the inherent business of the company has a capital outlay that offers higher returns on capital OR failing that, that the market value of the company’s equity is low to offer another conduit for reinvestment. Barring these two circumstances, returns should be given out as dividends.

This is unintuitive in that sometimes companies engage in really destructive practices with share buybacks. They are not universally good, especially if the future cash generation of the business is spotty. Likewise there are circumstances where buybacks work to massive benefit (a good historical example was Teledyne). However, in all of these cases, investors must possess a crystal ball and be able to forecast that the cash generation of the existing business (in addition to any other potential future capital expenditures) will be sufficiently positive over the required rate of return.

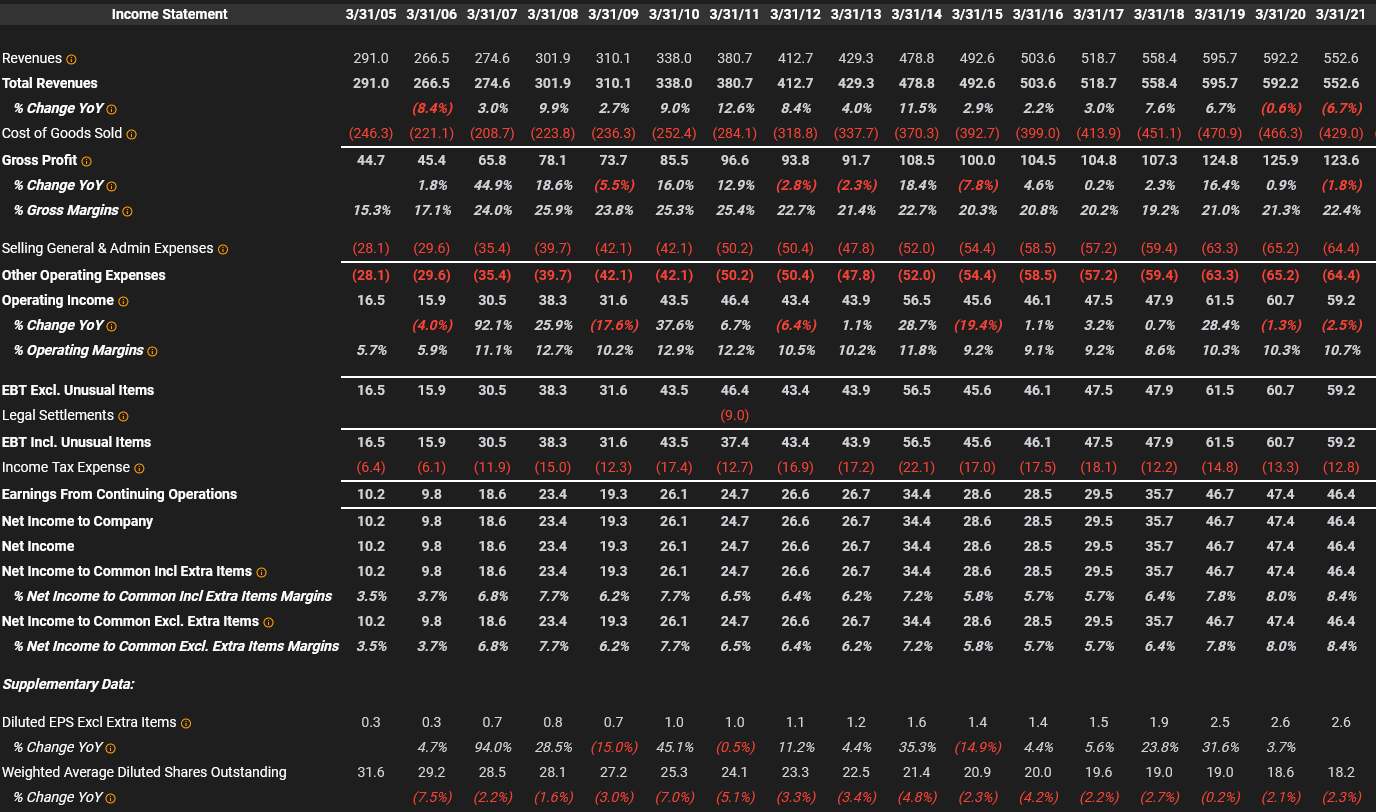
For example, Corvel (Nasdaq: CRVL) has a very extensive history of share buybacks:

The Company’s Board of Directors approved the commencement of a stock repurchase program in the fall of 1996. In May 2021, the Company’s Board of Directors approved a 1,000,000 share expansion to the Company’s existing stock repurchase program, increasing the total number of shares of the Company’s common stock approved for repurchase over the life of the program to 38,000,000 shares. Since the commencement of the stock repurchase program, the Company has spent $604 million on the repurchase of 36,937,900 shares of its common stock, equal to 68% of the outstanding common stock had there been no repurchases. The average price of these repurchases was $16.36 per share. These repurchases were funded primarily by the net earnings of the Company, along with proceeds from the exercise of common stock options. During the three and six months ended September 30, 2021, the Company repurchased 165,455 shares of its common stock for $25.6 million at an average price of $154.48 per share and 284,348 shares of its common stock for $39.8 million at an average price of $139.81, respectively. The Company had 17,763,576 shares of common stock outstanding as of September 30, 2021, net of the 36,937,900 shares in treasury. During the period subsequent to the quarter ended September 30, 2021, the Company repurchased 49,663 shares of its common stock for $8.7 million at an average price of $176.02 per share under the Company’s stock repurchase program.

We look at the financial history of the company over the past 15 years:

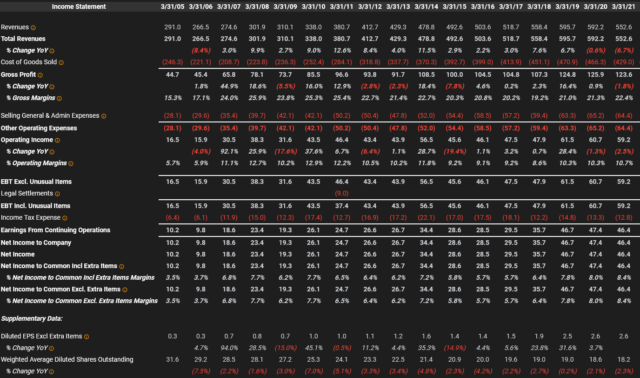
This is a textbook example that financial writers should be writing case studies about up there with Teledyne (NYSE: TDY) as this has generated immensely superior returns than if they had not engaged in such a buyback campaign. Share repurchases made over a decade ago are giving off gigantic benefits to present-day shareholders and will continue to do so each and every year as long as the business continues to make money.

The question today is whether this policy is still prudent. The business made $60 million in net income and there stands little reason to believe it will not continue, but should the company continue to buy back stock at what is functionally a present return of 2%? The business itself cannot be scaled that much higher (they primarily rely on internally developed research and development expenses and do not make acquisitions).

It only makes sense if management believes that net income will continue to grow from present levels. One has to make some business judgements at this point whether the company will continue to exhibit pricing power and maintain its competitive advantages (in this respect it looks very good).

Another example we are seeing in real-time is Berkshire (NYSE: BRK.a) using its considerable cash holdings to buy back its own stock. In the first 9 months of this year, they have repurchased just over 3% of the company. There’s more value right now in Berkshire buying its own massively cash-generating options than there would be on the external market – the last major purchase Berkshire made was a huge slab of Apple stock in 2017/2018 which was a wildly profitable trade.

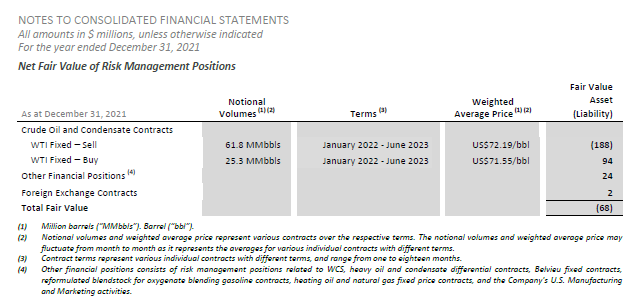
In the Canadian oil and gas industry, right now we are seeing the major Canadian companies deal with the first world problem of excess cash generation. They are all in the process of de-leveraging their balance sheets and paying down (what is already low interest rate) debt, but they are also funneling massive amounts of money into share buybacks.

For example, Suncor (TSE: SU) and Canadian Natural (TSE: CNQ) are buying back stock from the open market at a rate of approximately 0.5% of their shares outstanding each month. Cenovus started their buyback program on November 9th and intends to retire 7% of shares outstanding over the next 12 months. The financial metrics of these companies are quite similar in that with oil at existing prices, an investment in their own stock yields a far greater return than what you can get through the uncertainty of opening up a major project (good luck getting through the environmental assessment!). My estimate at present is around 15% return on equity for these buybacks and needless to say, this will be great for shareholders.

It is why an investor should want low equity market values as long as these buybacks continue and the pricing power of the companies remain high. In the oil patch, this of course requires a commodity price that by all accounts should remain in a profitable range for companies that have had their cost structures streamlined and capital spending requirements that have been curtailed due to a hostile regulatory regime. The returns from these share buybacks are likely to be immense, barring a collapse in the oil price.

The MEG Energy Takeover Sweepstakes

Following up on my article “When will Cenovus or CNQ buy out MEG Energy?

Things have evolved since Husky Energy tried to take out MEG Energy at $11/share back in October 2018:

At the time of the Husky offer, WTI oil was at US$75/barrel, MEG had 297 million shares outstanding (today they are at 307 million), and they had $3.2 billion net debt (today they are sitting at under $2.6 billion). Annual production in 2018 was 87.7 kboe/d, while in 2022 it will be around 95-96 kboe/d.

By all accounts MEG is in better shape today than it was 3 years ago. Will it be CVE or CNQ to first offer a stock swap for a 30-40% premium over the current price?

The big hidden asset not readily visible comes from the following two paragraphs on MEG’s financial statements:

With WTI at US$70/barrel, it will take a very, very long time to dig through these tax pools. Simply put, $5.1 billion in non-capital losses represents an additional $1.2 billion of taxes that can be bought off in an acquisition. With the way things are going, Cenovus will be able to eat through their tax shield mid-decade (they also inherited a tax shield from the Husky acquisition), and CNQ’s tax shield is virtually exhausted at this point (they did acquire some with their announced acquisition of Storm Resources on November 9th, but this will go quickly as Storm had about half a billion in operating loss and exploration credits).

Either way, this tax pool is a ‘hidden’ asset and will bridge the differential between the current market value and a takeover premium. Since valuations in the oil patch are still incredibly depressed (enterprise value to projected free cash flows are still in the upper single digits across the board), a stock swap makes the most sense.

Operationally this is the most likely course of action – without a major capital influx, MEG is constrained to around 100kboe/d of production and things will be pretty much static for them after this point. The only difference at this point is whether Western Canadian Select valuations rise (having Trans-Mountain knocked out for two weeks did not help matters any) and what the final negotiated value will be. The acquiring entity will be able to integrate MEG’s operations to theirs quite readily and shed a bunch of G&A after they pay out the golden parachutes.

Needless to say, I’ve had shares of this at earlier prices.

Large Cap Canadian Energy

A briefing note. I do not think any of this thinking below is original by any means, but it needs to be said.

On May 26, Suncor (TSX: SU) guided at WTIC US$60 in 2021 and US$55 in 2022 (which is presently US$68 and US$62 for the year-end contracts, respectively) a free cash flow of $7 billion. This is after a $3 billion capital expenditure in 2021.

The guidance was notable in that the 9 megabyte slide deck they provided went through great pains to downplay the amount of cash they actually were going to generate (in typical Canadian fashion, it is like they are embarrassed to admit they are making this much money), but let’s play along.

Suncor’s enterprise value is about CAD$60 billion, about $45 billion market value and $15 billion debt.

Let’s do some basic math. This is grade school finance.

It means if the company can produce cash at the present rate (which, in general, they can given the nature of what they are mining at the present capital expenditure rate), if directed to debt and equity, they will be able to pay off all their debt and repurchase their entire share stack (at current prices – it will rise over time) in 8.5 years.

This doesn’t include changes in the selling price of oil, which the above figure is currently below market.

This is a little more complicated to calculate the sensitivity to commodity pricing. Companies give out sensitivities and for every dollar on Brent (not quite WTIC, but deeply correlated), Suncor changes its funds flow through operations by about CAD$300 million. Very roughly, subtract royalties and taxes (no more tax shield, they made too much money already) and it is about CAD$200 million leftover.

I note that at current pricing, an $8 positive oil price difference over the model (note: do not confuse with the Canada/USA differential) changes the 8.5 years alluded to above into about 7 years.

You just need to make the assumption that oil pricing will stay steady.

If this is the case (or heaven forbid, oil rises even further), Suncor is ridiculously undervalued.

This doesn’t even factor in the WCS/WTIC differential, which is likely to close once Line 3 is completed (end of the year) and TMX is finished (2022?). This will be the freest money for all stakeholders involved. An extra US$5 off the differential (it is now about US$15) on Suncor’s capacity is about US$1.5 billion a year – suddenly 7 years now becomes 6 years.

Not surprisingly, the company is buying back stock like mad, probably because there isn’t anything else they can really do with the excess cash flow.

In the past couple months, they’ve bought back US$375 million in stock, 17.2 million shares (about 1.1% of the outstanding). They should aim to buy back the maximum they can at current pricing.

As this continues, the stock price will rise and make future buybacks less attractive. After the appreciation, they should jack up the dividend.

Normally businesses would also invest in capital expenditures, but in Canada, we are closed for business for any significant natural resource projects. We mine what we have left, which makes the decisions easy – harvest cash.

What is the thesis against this?

The obvious elephant in the room is the sustainability of oil pricing.

I have no doubt in 100 years from today that fossil fuel consumption, one way or another, will be seriously curtailed. It will likely be too expensive to use in most applications that we see today.

But in 8.5 years? Get real. Oil sands reserves are measured in decades.

The other obvious component of “Why are they letting me have it so cheap?” is political correctness in the form of ESG. Much demand is sapped because of this. Many institutions cannot touch oil and gas, including Berkshire Hathaway.

Eventually through buybacks and dividend payments, the market will adjust this.

The margin of safety here is extremely high and nothing comes close in the Canadian marketplace, at least to anything with over a billion dollar market cap.

The same reasoning above also applies to Canadian Natural Resources (TSX: CNQ) and Cenovus (TSX: CVE). They are also in the same boat in terms of their FCF/EV valuation, and also with similarities in their operations. Once they reduce leverage, they will be buying back stock like crazy if it is still at the current price. I don’t know how long this will last.

Sometimes things are so obvious in the markets you really wonder what the trick is, but with this, it is the closest thing I can think of picking up polymer cash notes on the street. Efficient market theory would tell me that those cash notes wouldn’t be there. Perhaps traditional finance theorists might be right, we will see. At least I can take some solace when I am at the gas station and seeing record-high prices.