The following is an extract of the WTI oil futures curve:
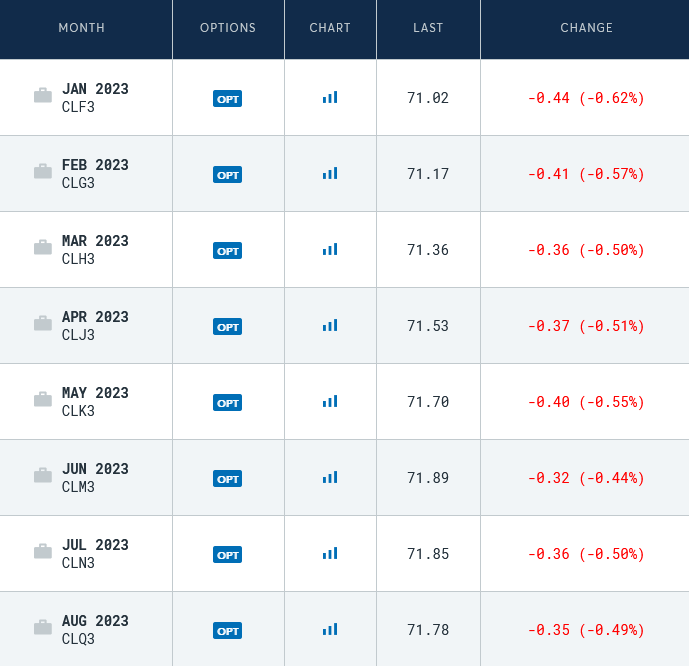
The price of current-day (spot) crude is about 1% cheaper than the price of oil half a year out.
Let’s run a refresher course on the basic mechanics of futures pricing.
All things being equal, a clean futures curve will price the interest rate curve into forward prices, minus storage costs.
For instance, if today you can buy a barrel of oil for $100 and tomorrow you can sell it for $110, you would want to dig the trench in your backyard and store the oil there for a day so you can sell it for 10% profit. (You can do the math on an annualized return over a day!).
Ignoring storage costs, if you have to chew up $100 of capital to hold your oil, there is an implied carrying cost to holding that oil instead of selling it immediately to put into risk-free securities. This is a function of interest rates.
So a theoretical market would reflect this opportunity cost loss.
Let’s pretend your interest rate is 5%.
One would be indifferent to a $100 spot price today vs. $105 a year from now, again, emphasizing no storage costs.
For financial futures, other than a few electrons, there are no storage costs. This is why you see S&P 500 futures pricing up roughly a percent for each three months of the contract duration. Sophisticated funds can arbitrage by buying the index today and selling the future 3 months out, and pocket the spread – don’t forget about those equity dividends! This is a very roundabout way of investing in a 3 month interest product.
However, for commodities, there are storage costs and also the ebb of projected supply and demand characteristics of the underlying. An example from the natural gas market – the blowup at the Freeport LNG facility (which is still under repair) had their futures project, quite rapidly, increased supply over a limited time frame. When the promises of an early repair date evaporated quicker than LNG at room temperature, the futures curve adapted accordingly.
Another variable concerning physical commodities is that physical ownership might convey some other benefits that come with income – such as gold leasing.
Going back to crude futures, this is the first time awhile where the spot month is exhibiting a “normal” sloped curve, at least for the first half year or so. The “peak” of the curve is in October 2023 and then the price slopes downward again. This is an unusual situation.
It’s been clear to me since the June peak that the game has changed from one of scarcity to one of much more conventional metrics – can you identify the firms that will survive in a lower price environment? Do you actually want to be in a space that might potentially be a “grind to the bottom” again as companies increase capital investing and have balance sheets to sustain potentially unprofitable production?
We went through that in 2014, where supply really accelerated and crushed the crap out of the oil and natural gas market.
The question here is whether supply is nearly as constrained (either for ESG reasons or geological reasons) as the narrative would suggest.
Chartering for offshore drillers (pace, tenor, rate) is another interesting data point. Agreement to a multiyear contract for a drillship at $400k/day implies certain expectations (which may be right or wrong) about oil pricing, demand, and future supply.
I wonder if wcp is regretting their purchase of xto now. They were on track to have virtually no debt by early 23. I was quite bullish on them that deal soured it for me.
I wasn’t a fan of the acquisition either. The real payout for it should be in a few years after LNG Canada gets (hopefully) built and AECO starts ramping up especially since the XTO acquisition was gas-heavy.
I’m debt adverse as well but I can see why they rolled the dice. Even with US$70 oil they should be generating a billion of FCF. Their dividend ramp-up strategy is appropriate although on paper an investor would be even happier if they lowered it to zero while they chip away at debt which is no longer inexpensive.
That said if I wanted a pure zero-income investment with liquids exposure, MEG is the closest thing to it. At the rate WCS is going they might be giving it away for free to the Americans in a couple months.