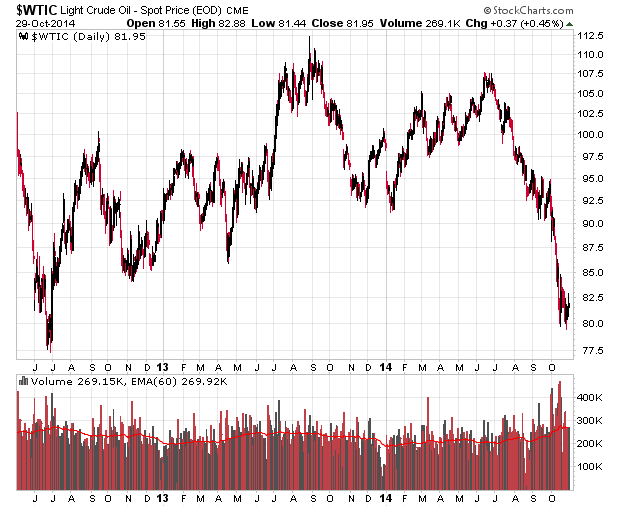
As readers may suspect, I have been intensively looking at the oil and gas producer market directly as a response to the rapid decrease in world oil commodity prices over the past three months.
I don’t know whether oil is going up or down from here, but from the US$75 perch it is at today, I would suspect it is more likely than not we will see a US$100 (+33%) WTIC barrel price rather than US$50 (-33%).
I decided to restrict my choices to strictly oil and gas producers that are within the confines of Canada. I have a fairly solid grasp of the regulatory and legal side of what Canadian producers face and also a good feel for the political climate that may drive economic changes within the various firms (e.g. provincial governments deciding to tinker with royalty rates).
Go take a look at Transglobe (TGL.TO) if you believe you have any idea what the political-economic stability of Egypt is. If you think they will be all right, then you’ll stand to make a small fortune.
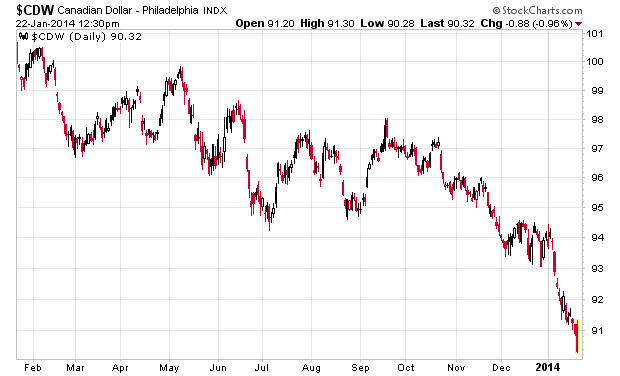
In the Canadian world, crude oil trades at a discount to the prevailing WTIC price for a variety of reasons. Heavy oil producers have an even higher penalty on pricing. The differential is unlikely to change soon and this has generally been the focus of the Canadian government to address the differential (via pipelines, and opening up an export route to east Asia via BC which is not likely to happen anytime soon). The discount that Canadian crude has over the prevailing North American price is a significant economic issue for those that derive their living from Canadian energy, but it is such a political issue that I will stop talking about it here. What is financially relevant, however, is the market is very well aware of this and is not pricing in any anticipation of the Canadian pricing disadvantage stopping anytime soon.
I will give an example. If a surprise deal is reached with the relevant First Nations bands in British Columbia and the Northern Gateway project is commenced, you would see a huge spike in Canadian oil and gas producers for sure.
After doing a ridiculous amount of exhaustive analysis, I realize that from my third party perspective it is going to be very difficult to pick alpha from companies that have very cookie-cutter characteristics and that indexing is the better way to go. Unfortunately most Canadian indicies and ETFs (e.g. XEG.TO) involve a huge concentration of Suncor, CNQ, Cenovus, Crescent Point, EnCana, Husky, etc., and while I think these are fine companies that will likely survive to the point when I start collecting Old Age Security, they do not offer the most potential for appreciation. So instead of going for an index ETF, I decided to just create my own mini-ETF with a few positions. I have taken a position in three companies with average sized positions. I had intended to do four but one of the names has since climbed higher than what I was willing to pay for it.
I’ve decided on creating a mini-index for myself consisting of PWT.TO, PGF.TO and DTX.TO. The first two should be well known to most people. They have been around since the former income trust glory days and are income-oriented investments. Despite the fact that they have massively huge yields (which had nothing to do with the investment decision at all), I generally believe PWT’s new management is on the right track (reduce debt, focus on costs, be up-front with shareholders when your previous CFO was over-aggressively capitalizing expenses, etc.). PWT is unhedged.
PGF has an heavy oil project that is being heavily discounted by the market simply because they are throwing so much more cash out presently than they are taking in, but they will receive a huge benefit from such expenditures from 2015 onwards in a Cenovus-like manner and then they will be able to get their debt metrics in order. They have hedged roughly 2/3rds of their 2015 production at ~US$84 and from there they will appropriately try to game the commodity market.
DTX, whether through luck or purposeful selection, appears to be a very heavily profitable producer. They don’t give out a dividend because they want to grow (which is exactly what they should be doing given their reinvestment returns). They’ve hedged about 1/6th of their production in 2015 at around US$88-ish (good market timing!).
There’s more to the above stories but I will leave it at that.
The price depreciation over the past half year in all of these issues has led to a margin of error factor that appears to present a good risk-reward ratio.
The last name that I wanted to include on the list was something heavy in gas rather than oil, and that was Birchcliff (BIR.TO). Unfortunately in their case, after I did my due diligence on them a couple weeks later than I should have and I was looking at a stock price that I thought I could time the market better than what actually happened (take a look at their last month of trading and you will see why). If they sink again to the single digits, I will likely be taking a position in them.
I wish a company like Peyto would crash down 50% but clearly this isn’t going to happen.
All of these companies have a possibility of being taken over by larger producers. They also all have insider purchases, which was a partial consideration in my sweep of companies.
I want to thank Neil J who offered some interesting comments on a previous post of mine. There is no way I would have reviewed DTX if it wasn’t for his comments. I very rarely pick off names that are brought to my attention in this fashion, but this was a rare, rare exception.
Given my relative uncertainty in underlying commodity prices (I am not a fan of commodities in general at this point in time, but I am making a very special exception for energy), I do not anticipate taking more than a total 20% position combined in oil and gas producers and related firms, but this is probably more weighing I’ve had in the sector for quite some time. I am comfortable holding this until we start seeing stories of peak oil and this sort of stuff again.