Today’s financial insanity – Tilray
I’m not sure what to say about this chart other than “holy crap”:
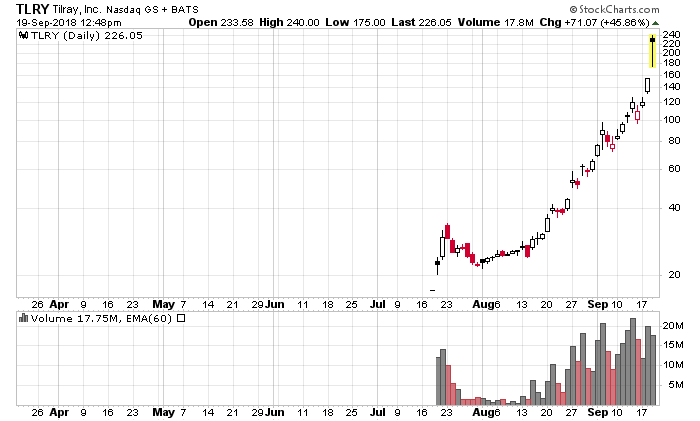
With a market capitalization now of $21 billion, Tilray is worth more than (insert the names of any companies that actually have real businesses with real profits here).
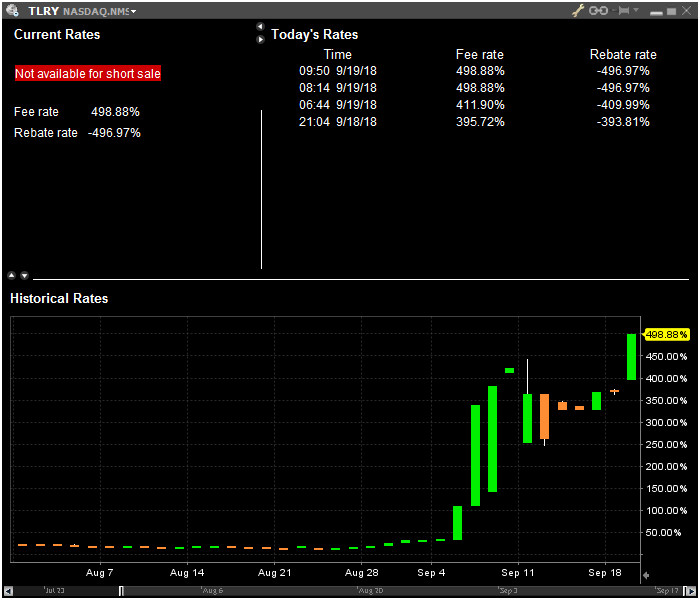
Short borrow rates are 500%:
Put options at a strike of $100/share, expiring in November, trade for around $25/share.
The only reason why anybody with two brain cells left with a bid on this one are the auto-indexers and the people that are receiving a margin call of the century going short against this one.
Readers should not be surprised to know the purported business of this company is cannabis production. Their only quarterly report to date (as you can see by the stock chart above, they have not been public for very long) is here (Link to 10-Q).
I have not seen this insanity since the dot-com era of 2000. Be careful. It ends badly.
Somewhat disappointed by Enbridge buyout offer
I’ve been writing about Enbridge (NYSE: ENB) and their process of re-acquiring their daughter entities, including EEP, EEQ and ENF. They already formalized the arrangement with Spectra Energy Partners (NYSE: SEP), which I wrote about earlier.
For EEP, I was anticipating a slightly higher exchange ratio (0.35 vs. the 0.335 offered).
I own call options in EEP. Valuation-wise they should trade like call options in Enbridge, with a minor dividend differential (EEP will declare one more $0.35 distribution for the quarter which option holders will effectively receive by virtue of the exchange arrangement, which will be offset by Enbridge’s quarterly dividend).
Enbridge is getting a steal of a deal on EEP – once the Line 3 expansion project becomes operational (scheduled for 2019 and unlike Trans-Mountain, the regulatory way has already been cleared for construction), the amount of cash flows available will be even more immense than the existing $6.6 billion/year they are currently doing (just eyeballing their June 30, 2018 financial statements). Once stripped of all the politics and drama of pipeline construction, it is a pretty boring company to analyze, but one that is a reasonably valued blue chip component in anybody’s portfolio. The fact that there is so much protection in the industry will assist, in addition to them being able to raise rates at the rate of inflation, while paying down their debt in nominal dollars.
Enbridge is also the type of company that would be able to survive an economic recession – as long as the oil flows. And oil will be flowing for a very long time.
I’m holding onto my call options in EEP. They expire in 2019 so I am in no rush to liquidate the position – as ENB appreciates (and it will), the call option position will also reflect this. I can see ENB heading to around CAD$48-50/share by the end of the year which would put EEP at around $12.60 with a 0.77 CAD/USD. Once I’ve squeezed another dollar out of the position I’ll probably sell the options.
Interactive Brokers / IEX / Commission-Free Brokerages
Interactive Brokers has always been the leading innovator in the brokerage realm. Normally companies that last 40 years get stale and eventually break when they can’t keep up with technological or market trends, but IBKR has been surprisingly agile and has most definitely been on the leading edge of the curve the whole time – being able to develop their business (e.g. TWS giving all of its users institutional-quality levels of market access), create a moat (e.g. TWS, margin rates, trading execution, and on and on), and also have the ability to get out of businesses that no longer work for them (e.g. the disposition of their market making).
They were the first brokerage available to retail customers that offered two-factor authentication, something that makes me sleep a lot better at night. I would not recommend using any brokerage that does not use two-factor authentication for serious amounts of money.
IBKR is slowly getting into the banking and cash management side of things, which is another huge avenue for future growth. They clearly have an organic growth policy so when this policy will eventually pay out in spades is unknown, but I think they are on the right track.
Unfortunately, IBKR’s stock is only 18% publicly available – the trading entity (IBKR) only owns a slim minority (17.8%) of shares of the operating firm. Most of the stock is owned by the founder and CEO, Thomas Peterffy, who I regard as the Steve Jobs of the online trading business. He has been outspoken on many issues concerning the brokerage world and one of them is the issue of high-frequency trading and brokerages effectively ripping off their own customers.
This is one of the reasons why Interactive Brokers decided to re-list their shares on IEX instead of Nasdaq, starting in October.
In one of the typical understatements by Peterffy, he states:
We at Interactive Brokers understand that being the first listing on a new exchange may entail certain risk, but we think that individual and institutional customers who own and trade our stock will receive better execution prices and that advantage will outweigh the risk.
Peterffy has an advantage in that he doesn’t have to care whether IBKR trades in liquid amounts, and indeed doesn’t even have to care how much IBKR stock trades for since they have no need or reason to raise capital. Indeed, one of their strategic purposes for IBKR stock to trade was as a marketing vessel for institutional clients and given the statistics IBKR releases, it seems to be working quite well. It was only about a decade ago that they made the corporate decision to actually spend money on advertising. IBKR’s rise is well worth the history lesson, but I won’t go into it too deeply here.
Instead, what I want to focus on is the upcoming hype that came with Wealthsimple Canada’s announcement that they will have a commission-free stock trading platform in Canada coming soon.
The question a customer should ask is how brokerages make money.
In short order, some answers are the following (in no particular order):
a) Trading commissions
b) Interest revenues on customer credit balances
c) Foreign exchange differentials
d) Margin interest (i.e. customers borrowing money from the brokerage to invest)
e) Stock lending (if a customer buys stock, the brokerage can lend them out for short selling, which they will earn interest for the borrow)
f) Selling (or using) customer trading data
g) Selling order flow
Item (g) is what I will focus on. Firms such as Virtu (Nasdaq: VIRT) make a lot of their “bread and butter” purchasing order flow from retail firms and giving their clients less than optimal executions. As a result, while customers can save $5 or $10 on a trading commission, they are instead paying for it with a reduction in the ability to shave more money from the bid-ask spread.
After Flash Boys, people have been more conscious of this, but your average retail investor only believes the cost of trading is the commission, which is most certainly not true.
While the actual dollar amounts are inconsequential when trading with low sized accounts and the choice of brokerage has little bearing on the overall result, trading execution becomes much more critical with higher amounts of money and choosing a brokerage that makes money by offering inferior trading executions will cost customers real amounts of money, well beyond any commissions that would be saved. The more a customer anticipates trading, especially in lower liquidity securities, the more they will likely lose in inferior execution costs.
In finance and business, there is nothing that is truly “free”, and commission-free trading is most certainly included in that category.
Past Comments – Trans-Mountain Pipeline
From my July 1, 2018 post:
Trans-Mountain Pipeline
This is a political disaster for the Liberals. It will be an even bigger political disaster when they try to tender the contracts to build the pipeline. It is a recipe for over budget, behind schedule politics, especially since the protestors know that any construction will be fueled by even more political pressure than it being built by a corporate entity. I do not believe this pipeline will be built even after the federal government bailed out Kinder Morgan Canada (TSX: KML).
Just remember, the government that can’t even build a gun registry or payroll system for themselves without spending more than a billion dollars of taxpayers’ money are trying to build an energy pipeline. Best of luck!