I’ve been examining the wreckage of the market carnage over the past few days (these types of high volatility situations tend to create opportunities) and in general I have not been too impressed with what I have seen. Either that, or what I have been examining has been unfruitful material.
The big exception: the oil and gas sector.
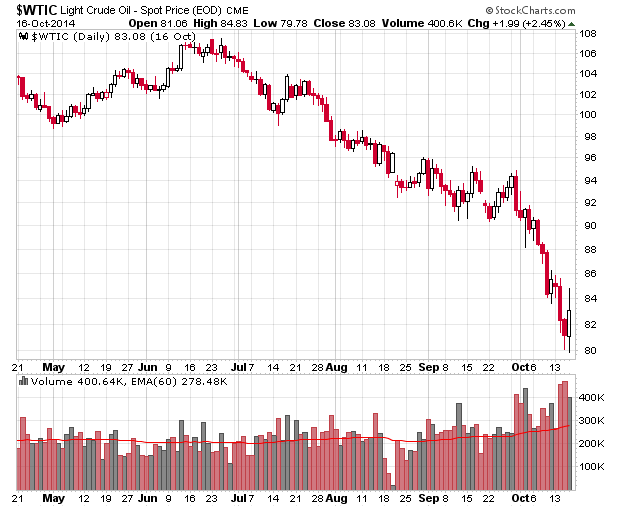
The reason why they have cratered is because of this chart:
Then I start scouring the list of TSX oil and gas sector companies that are over a market capitalization of a billion dollars. The TSX maintains a comprehensive list of listed companies which I find to be of surprising value when I look for quick lists of companies. I generally don’t tread below a billion in capitalization for resource firms since companies of that capitalization are dominated by insider information where a good drilling result will make the difference between life and death and the last person to get this information will be the outside public.
Larger capitalization companies also receive the benefit of financial economies of scale as they will be able to raise capital in meaningful amounts at lower costs – just imagine if you were a bank lending to a $10 million microcap exploration company versus lending to Suncor – a world of difference.
I also exclude anything international (e.g. CNOOC) as my comfort level with companies with international operations (outside Canada/USA) is quite low. There are some Canadian companies with international operations (e.g. Husky) but I have not excluded them from the list.
This leaves the following:
| Name | Root Ticker | QMV(C$) 31-August-2014 | O/S Shares 31-August-2014 | Price Aug 31 | Price Oct 17 | Diff |
|---|---|---|---|---|---|---|
| Suncor Energy Inc. | SU | 65,392,529,963 | 1,465,214,653 | $44.63 | $37.43 | -16.1% |
| Canadian Natural Resources Limited | CNQ | 51,752,147,469 | 1,092,047,847 | $47.39 | $38.64 | -18.5% |
| Imperial Oil Limited | IMO | 49,042,078,776 | 847,599,011 | $57.86 | $51.56 | -10.9% |
| Husky Energy Inc. | HSE | 32,835,380,634 | 995,641,711 | $32.98 | $27.89 | -15.4% |
| Cenovus Energy Inc | CVE | 26,251,047,328 | 756,950,615 | $34.68 | $26.44 | -23.8% |
| Crescent Point Energy Corp. | CPG | 19,054,037,160 | 423,423,048 | $45.00 | $37.80 | -16.0% |
| Encana Corporation | ECA | 18,575,904,053 | 740,961,470 | $25.07 | $20.99 | -16.3% |
| Talisman Energy Inc. | TLM | 11,519,723,579 | 1,044,205,268 | $11.03 | $7.41 | -32.8% |
| Canadian Oil Sands Limited | COS | 11,349,573,179 | 484,610,298 | $23.42 | $17.97 | -23.3% |
| Tourmaline Oil Corp. | TOU | 11,093,225,024 | 201,438,624 | $55.07 | $46.15 | -16.2% |
| ARC Resources Ltd. | ARX | 9,961,515,096 | 316,942,892 | $31.43 | $28.70 | -8.7% |
| MEG Energy Corp | MEG | 8,663,315,635 | 223,684,886 | $38.73 | $29.03 | -25.0% |
| Baytex Energy Corp. | BTE | 8,074,310,078 | 166,069,726 | $48.62 | $36.10 | -25.8% |
| Vermilion Energy Inc. | VET | 7,547,863,325 | 106,713,747 | $70.73 | $64.36 | -9.0% |
| Paramount Resources Ltd. | POU | 6,310,684,139 | 104,654,795 | $60.30 | $51.77 | -14.1% |
| Peyto Exploration & Development Corp. | PEY | 5,921,706,832 | 153,690,808 | $38.53 | $34.20 | -11.2% |
| PrairieSky Royalty Ltd. | PSK | 5,135,000,000 | 130,000,000 | $39.50 | $34.00 | -13.9% |
| Enerplus Corporation | ERF | 5,108,169,000 | 205,229,771 | $24.89 | $17.15 | -31.1% |
| Whitecap Resources Inc. | WCP | 4,521,895,736 | 245,621,713 | $18.41 | $14.98 | -18.6% |
| Penn West Petroleum Ltd. | PWT | 4,182,765,734 | 495,001,862 | $8.45 | $5.51 | -34.8% |
| Pengrowth Energy Corporation | PGF | 3,938,186,665 | 531,408,321 | $7.41 | $4.90 | -33.9% |
| Athabasca Oil Corporation | ATH | 3,181,210,140 | 401,667,947 | $7.92 | $4.46 | -43.7% |
| Trilogy Energy Corp | TET | 3,034,453,657 | 105,071,110 | $28.88 | $20.80 | -28.0% |
| Bonavista Energy Corporation | BNP | 2,991,583,651 | 201,861,245 | $14.82 | $11.61 | -21.7% |
| Africa Oil Corp. | AOI | 2,120,742,964 | 312,333,279 | $6.79 | $4.14 | -39.0% |
| Bonterra Energy Corp | BNE | 2,112,574,633 | 32,086,492 | $65.84 | $53.82 | -18.3% |
| Gran Tierra Energy Inc. | GTE | 2,003,447,146 | 274,821,282 | $7.29 | $5.37 | -26.3% |
| Raging River Exploration Inc. | RRX | 1,980,564,289 | 180,051,299 | $11.00 | $8.14 | -26.0% |
| Birchcliff Energy Ltd. | BIR | 1,969,417,138 | 150,796,625 | $13.06 | $9.16 | -29.9% |
| Freehold Royalties Ltd. | FRU | 1,925,524,146 | 74,058,621 | $26.00 | $21.48 | -17.4% |
| Northern Blizzard Resources Inc. | NBZ | 1,914,042,495 | 101,810,771 | $18.80 | $15.85 | -15.7% |
| Surge Energy Inc. | SGY | 1,889,478,484 | 217,681,853 | $8.68 | $6.54 | -24.7% |
| Parex Resources Inc | PXT | 1,877,462,466 | 126,287,061 | $14.87 | $10.73 | -27.8% |
| Kelt Exploration Ltd. | KEL | 1,731,091,845 | 126,727,075 | $13.66 | $10.55 | -22.8% |
| Bankers Petroleum Ltd. | BNK | 1,721,811,689 | 260,880,559 | $6.60 | $4.67 | -29.2% |
| Bellatrix Exploration Ltd | BXE | 1,611,292,542 | 191,364,910 | $8.42 | $5.59 | -33.6% |
| NuVista Energy Ltd. | NVA | 1,583,757,118 | 135,944,817 | $11.65 | $10.05 | -13.7% |
| Legacy Oil + Gas Inc | LEG | 1,563,886,292 | 199,730,050 | $7.83 | $5.06 | -35.4% |
| TORC Oil & Gas Ltd. | TOG | 1,362,827,028 | 93,344,317 | $14.60 | $11.29 | -22.7% |
| Painted Pony Petroleum Ltd. | PPY | 1,362,274,683 | 93,627,126 | $14.55 | $11.38 | -21.8% |
| Crew Energy Inc. | CR | 1,359,860,601 | 121,960,592 | $11.15 | $7.90 | -29.1% |
| Oryx Petroleum Corporation Limited | OXC | 1,296,506,662 | 119,825,015 | $10.82 | $9.47 | -12.5% |
| Lightstream Resources Ltd. | LTS | 1,257,107,698 | 200,176,385 | $6.28 | $4.08 | -35.0% |
| Advantage Oil & Gas Ltd. | AAV | 1,228,830,837 | 170,651,966 | $7.20 | $5.10 | -29.2% |
| Long Run Exploration Ltd. | LRE | 1,097,545,166 | 194,204,965 | $5.65 | $3.58 | -36.7% |
| Spartan Energy Corp. | SPE | 1,096,574,094 | 262,338,300 | $4.18 | $3.22 | -23.0% |
| RMP Energy Inc. | RMP | 1,068,310,163 | 122,092,590 | $8.75 | $6.30 | -28.0% |
A cursory look reveals that the quoted market price of all of these corporations are significantly less than what they were from August 31st, however, some got hammered more than others.
Whenever one invests in a resource company, there is always the implicit assumption that you believe the commodity price underlying the resource will rise. There is absolutely zero point in investing otherwise unless if there is a very special situation to warrant it (e.g. the firm in question has a huge hedged position on the resource that will allow it to economically outlast its soon-to-be bankrupt peer group).
Ideally you want to invest in a company with a cost structure that is at the marginal point of profitability and that has the market pricing the company assuming it will make little money in the future, and then have the commodity price increase. The embedded leverage in these high cost producers is significant – and I will keep on repeating this – under the assumption that the underlying commodity price increases.
Looking at the “least and most killed” list, we have two companies that I consider to be the cream of the crop in the Canadian oil and gas industry, ARC Resources (TSX: ARX) and Peyto Exploration (TSX: PEY) that are scratched – about 9 and 11% losses, not too bad considering the drop in commodity prices. These two companies have quite good managements and they are very focused on financial return on investment. I actually consider it too bad they did not get a 25 or 30% haircut as they are reasonably good “grandmother and grandfather” type equities that should be able to weather the full storm of a commodity cycle.
On the “ripped to shreds” list, we have Athabasca Oil Corp (TSX: ATH) that I will not touch because they simply have the incorrect economic structure (this can be saved for another post although you can read me correctly passing up on their IPO on this post).
Working the way down the losers list, a few names caught my attention. Lightstream Resources (TSX: LTS), formerly Petrobakken (TSX: PBN) is an entity that I will not be investing in, but I amusingly note that it is finally reaching what I would consider to be a fair value. There was a very dedicated individual out there that was deriding my analysis on its over-valuation which the market finally appeared to have corrected. (Feel free to read these articles here).
However, a couple old titans from the income trust era, Penn West (TSX: PWT) and Pengrowth (TSX: PGF) caught my attention. Penn West notably went through an accounting scandal when they changed top management and the subsequent audit resolved some issues pertaining to the capitalization of what should have been operating expenses. This involved the inflation of the net income line. Having the commodity oil market fall from underneath them did not help either. PWT made the unfortunate mistake of going to natural gas development at precisely the wrong time, but they hold a bunch of other more conventional oil assets which firmly put them in the ordinary category.
Notably they are trading at about a third of their stated book value. One would have to ask themselves if they were to start up that company from scratch how much would be paid to do so. Even when dumping goodwill and accumulated exploration assets (money already spent to do exploration work), there’s still about $4.9 billion in equity on the balance sheet while the market cap is around $2.7 billion today. Just from a fundamental value perspective, while previous investors got hosed, it may be a better entry point than not. The stock is likely to face tax loss selling pressure between now and the rest of the year so there’s not likely any rush to get in on a retail level.
Pengrowth is also going through an ambitious capital plan with the development of a heavy oil resource (their “Lindbergh” project) that apparently has good economics, along the lines of a Cenovus project. There is obvious execution risk with this project as many oil and gas companies have touted the promise of heavy oil while being able to produce nothing. The couple differences I see here is that Pengrowth has been in the game long enough (they’ve been public since 1989) that they should by now know what they’re doing, and also they’ve successfully executed on a pilot project that has dredged up a not trivial amount of oil from the ground already. Time will tell.
Dumping goodwill and exploration assets from PGF’s balance sheet leaves $2.4 billion in book value, while market value is about $2.6 billion presently. On its face it does not appear to be as good a value as PWT, but it appears relatively cheap from a valuation perspective.
Notably, Penn West’s equity is trading with incredibly high implied volatility – about 85% on the January series for an at-the-money option. Pengrowth’s volatility is muted (around 35%). Liquidity in their option markets is garbage, plus trading options on Canadian exchanges is a very expensive process in terms of trading costs.
Both firms give out dividends and are roughly at 10% yield at present market value. Yields might be compromised in the future if oil prices continue to decline. At least investors here clearly are not paying any premium for yield since I think most of them have been scared away from the common stock when they stare at their capital losses – a few months ago they were paying for a 5% yield and while they received that, they got a 50% capital loss in exchange.
The last time oil was at around US$80/barrel was in June 2012. Both companies’ equities were trading at significantly higher levels than they are now, plus they have the advantage of the Canadian dollar being about 10 cents lower than what it was a couple years ago.
Do I have any clue where oil is going in the future? No. However, if you believe things have stabilized, certain oil and gas producer stocks seem to have been sold off disproportionately and would probably make a decent entry point.
Any potential values in the US refiners such as VLO? I believe crack spread has held up pretty well despite the beating oil is taking. US refiners have pulled back a bit from the high as well.
Three years ago I remember putting in an order for VLO in my RRSP account in the teens. It is unfortunate that it did not get filled in.
I’d consider VLO (and TSO, etc.) to be good companies but so-so stocks at present valuations.