I couldn’t resist looking at the financial statements of Aphria (TSX: APHA) since I observed the marijuana sector today has received quite the bid. Today Aphria released their quarterly results and with the following by-line:
Aphria Inc. Announces Second Consecutive Quarter of Profitability and Positive Adjusted EBITDA
Looks good, right? There’s a lot of retail investors in these marijuana stocks, and most of them don’t read the detailed financial statements.
So when glossing over them, I notice this is a textbook case of “announced profits and positive adjusted EBITDA does not mean the company is making money”. Let’s dive further – this is a pretty good case study for beginning investors to learn how companies manage to put the most positive spin on their financial statements.
Look at the cash.
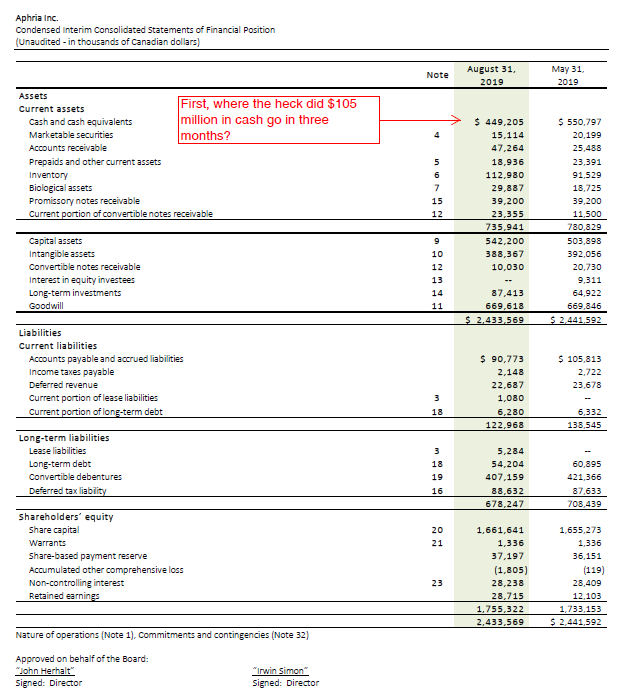
We look at the balance sheet to start with. The first red flag comes in the form of the very decreased cash+marketable securities balance. Sometimes in companies they have to invest initially (e.g. property, plant, equipment) in order to make money. Sometimes companies have large debt payments.
In this case, roughly $22 million went to accounts receivables. Normally receivables should correlate with revenues, but in this case, APHA’s Q1-2020 net revenues ($126 million) were actually LOWER than Q4-2019 ($129 million). Uh-oh…
Inventories and biological assets went up $21 million and $11 million, respectively. (Notes 6 and 7, which we will dive into below).
Capital assets went up $39 million.
All of this accounts for about $93 million of the $105 million cash burn. The rest of it, while interesting, I will disregard for the rest of this analysis – it isn’t the bulk of what’s happening. We’re trying to figure out where the cash is going.
Note 6, inventory:

I will give an example of what is going on here. Just looking at “Harvested cannabis”, the company spent $15.5 million to harvest this. “Capitalized cost” means they converted it into inventory using cash, without it being considered an expense. The “Fair value adjustment” of $20.3 million is management deciding that the value of the harvested cannabis is that much higher, and it can be reflected as such on the balance sheet. The process of doing this is a gain on the income statement, which I will show later.
The questions at this point is whether:
a) Is this estimate accurate? I have no idea.
b) Can the company actually sell this harvested cannabis at or greater than the adjusted value of $35.8 million?
Accounting-wise, inventories are governed by the rules of IAS2, which roughly states that inventories are kept at the lower of cost or net realizable value. These products are distinct from the biological assets, which are governed by IAS41.
Note 7, biological assets:

The key lines here are “Changes in fair value less costs to sell due to biological transformation” and “Production costs capitalized” for $25.2 and $29.8 million, respectively. This is effectively the company deeming that their growing process is facilitating an increase in value of their inventory when it is eventually transferred to that column, but in order to realize this, they need to sell the product!
Note 9, capital assets:
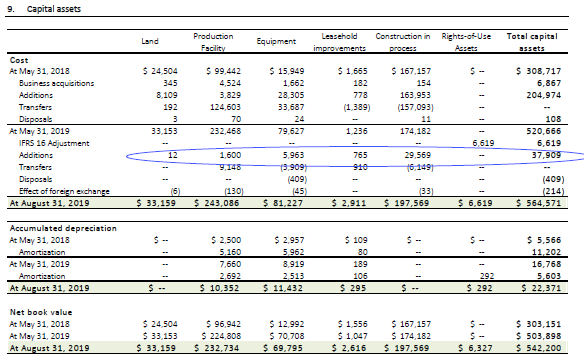
This actually looks reasonable. The company spent $37.9 million on production facilities, equipment, and construction-in-progress, which makes sense if you are a marijuana producer. The quantum of expense can be debated, but the nature of these types of expenses appear in-line with the type of business they are engaged in.
So how does APHA claim profitability?
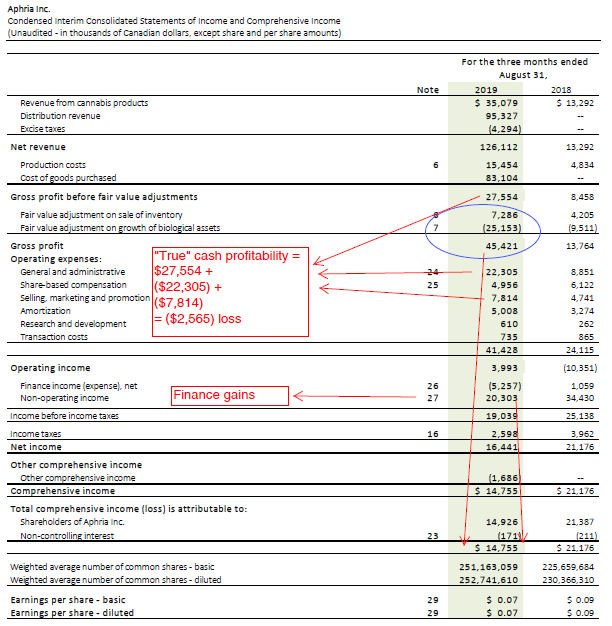
This dog’s breakfast of an analysis of the income statement drives a couple points:
1) The claimed profits are primarily on the basis of the fair value adjustments through Notes 6 and 7 in the financial statements (to the tune of $17.9 million)
2) And some finance gains on Note 27 (I will not bother getting into this).
In reality, the company is blowing a lot of money on inventory. It is very difficult to take the assertions of profitability seriously unless if you believe that the stated fair value gains on the inventory and biological assets are real and can actually be realized with real sales at the stated values.
I give no valuation opinion at this time other than to state that at $7.10/share (or $1.8 billion market capitalization at 252.7 million diluted shares outstanding) I am not interested in buying.
It took me about 5 minutes to gloss through these financial statements, but about an hour to present it in the very hurried form above. If I spent a couple extra hours, I could have really polished up the presentation, but this was enough for me. If you found this at all useful, please let me know.