With sudden amazement

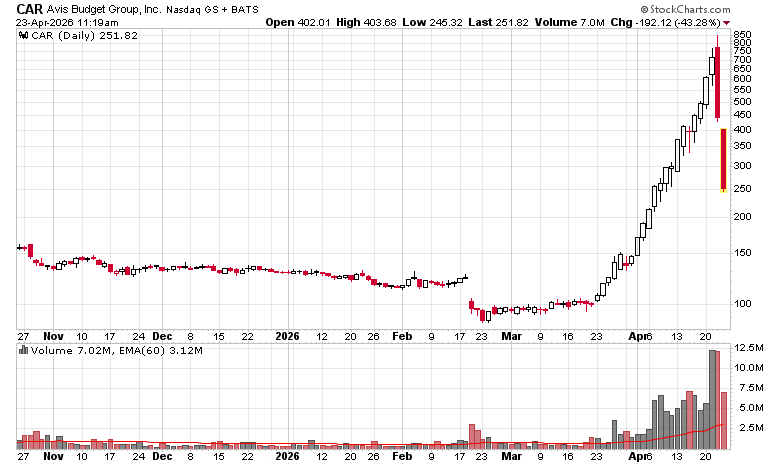
The bipolar market continues – we have companies like Rocket Lab (RKLB) shooting up into the stars, presumptuously in anticipation of the SpaceX IPO, and companies like Sandisk rising by a factor of 20x over the past year.

Conversely, I am looking at most of the usual suspects in software being down for the day – ADBE, CSU, etc.

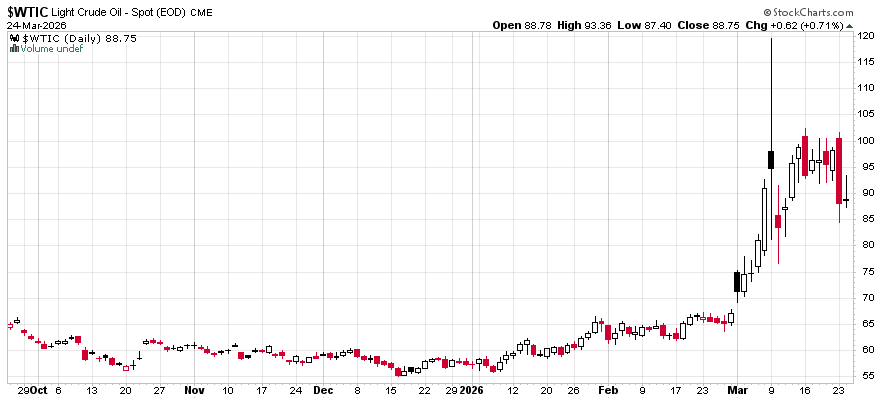
The war in the Middle East still continues and a good chunk of the world’s crude supply is still out of circulation. Every day that this continues is another layer of embedded cost in the real economy, which will take months for the ripple effects to show themselves. When the ripple effects show up in financial statements, many reactive algorithms will make adjustments accordingly.

I do note that many “traditional” names are fading away – Nike (NKE), Whirlpool (WHR), and LuluLemon (LULU) are depressed far below their traditional norms – are these brands going to be the Kodaks of this decade, where the foundation of the companies has essentially been hollowed out over time and not maintained? The only difference is that Kodak was a technology adaptation failure, while the three aforementioned companies are marketing brands, where shoes, washing machines and lifestyle clothing

Conversely, from a broad market perspective, perhaps this is the market’s way of saying that the “death of money” is occurring – and claims on companies that produce goods and services is what is driving demand and not necessarily the quantity of earnings they derive from fulfilling such demand.

Despite having a huge cash fraction in the portfolio, my YTD is still better than the primary indexes. It’s a very odd situation in that I do not feel particularly satisfied with the performance even though objectively things from a risk-adjusted perspective can be considered borderline perfect. It’s difficult looking at these things that are going up 20x in a year like Sandisk and wondering why you don’t have one in your own portfolio. Even if you took a 2% position in the stock at the beginning, if it goes up 20x, it would balloon to 29%.

Rollercoaster

Avis/Budget Group’s stock over the past month has gone fully psychotic:

It is almost as if somebody set an infinite dollar buy program to accumulate shares at increasing prices and then two days ago realized their computer program was broken and pulled the plug on it.

Skimming their financial statements, the explosion in the stock (going both directions) surely isn’t due to them being a hugely profitable entity. They are in a completely miserable industry.

The price to sales ratio, as it relates to software as a service valuations

I have been busy looking at the entrails of the various publicly traded software-as-a-service companies.

One thing that strikes out at me is the price to sales (or price to revenues) ratio.

Intuitively speaking, let’s say your market cap is $10 and you make $1 in sales a year.

Even if your cost of sales, G&A, R&D and the like is zero, the most profitability you can have as a company is a 10x P/E.

Of course 100% profitability will never will be the case – even if the company has completely outsourced its sales functions and just took a royalty on its product or intellectual property and had zero R&D function, there will always be costs associated with obtaining revenues. Of course, the “stripped down to taking royalties” company will be a calculation about the residual future demand and sales of said products.

While Boston Pizza Royalties (TSX: BPF.un) is as far away as a software-as-a-service company as it gets, the valuation concept is similar – BPF.un takes a 4% slice of every dollar of revenues that its franchises generate. The trust has zero employees, and in 2025, the trust’s administrative expenses was about 3% of revenues. The trust itself has some leverage expenses and is subject to income taxes payable at the trust entity level. When baking in all of these other expenses, they are still able to retain 53% of its revenues after-taxes which flow to the unitholders.

Based off of this, the market is giving BPF.un an enterprise value-to-sales (EV-to-royalties) ratio valuation of about 13 times. This is a ceiling, given that it is very unlikely that Boston Pizza will miraculously proceed to monopolize the restaurant scene in Canada and extract a disproportionate amount of pricing power – they are engaged in a highly competitive and mature industry with limited opportunities for growth.

Back to the SaaS side, we look at two other companies that are generally considered unassailable in their domains – Microsoft and Autodesk (AutoCAD is not going to get vibe-coded out of existence). Microsoft’s EV/S number is about 9.1x, while Autodesk is 6.4x. Both companies are far from being “royalty-like” in that they have huge operations, staffs, supports, R&D, etc.

Synopsys (Nasdaq: SNPS) is not exactly a household name, but their software is generally regarded as the industry leader in semiconductor design, has a EV/S of 10.5x. They are even less likely than Autodesk to get vibe-coded, and their valuation shows it.

One advantage of using EV/S as a lens is that it sidesteps the distortion caused by stock-based compensation, which is pervasive in software (particularly among newer companies) and can be a genuine pain to normalize across peers when trying to make apples-to-apples earnings comparisons.

Now for the more vulnerable end of the spectrum. Adobe (Nasdaq: ADBE) is currently trading at approximately 3.7x EV/S. Constellation Software (TSX: CSU), after losing over half its market capitalization in the past year, is roughly 3.3x.

If the market perceives a particular company’s software offerings as less defensible against AI, the EV/S ratio will continue to compress. Conversely, if you believe Adobe’s product suite has the same long-term survivability as Autodesk’s, it is not unreasonable to think its EV/S ratio should rise in the direction of Autodesk’s.

This analysis is very broad brushed, a view from 100,000 feet. But as a first-pass filter for what the market currently believes about the durability of a given software franchise, it is hard to beat for simplicity.

The return of Late Night Finance! – Episode 30

Date: Thursday, April 9, 2026
Time: 7:30pm, Pacific Time
Duration: Projected 60 minutes (might go a little late this time – I won’t be offended if you clock out after an hour).
Where: Zoom (Registration)

Frequently Asked Questions:

Q: What are you doing?
A: Portfolio review over the past 15 months since I have done this. The Big Picture. AI revelations. Prognostications. And finally time permitting, Q+A. Please feel free to ask them on the zoom registration if any questions.

Q: How do I register?
A: Zoom link is here. I’ll need your city/province or state and country, and if you have any questions in advance just add it to the “Questions and Comments” part of the form. You’ll instantly receive the login to the Zoom channel.

Q: Are you trying to spam me, try to sell me garbage, etc. if I register?
A: If you register for this, I will not harvest your email or send you any solicitations. Also I am not using this to pump and dump any securities to you, although I will certainly offer opinions on what I see.

Q: Why do I have to register? I just want to be anonymous.
A: I’m curious who you are as well.

Q: If I register and don’t show up, will you be mad at me?
A: No.

Q: Will you (Sacha) be on video (i.e. this isn’t just an audio-only stream)?
A: Yes. You’ll get to see me, but the majority will be on “screen share” mode with MS-Word / Browser / PDFs as I explain what’s going on in my mind as I present.

Q: Will I need to be on video?
A: I’d prefer it, dress code is pajamas and upwards.

Q: Can I be a silent participant?
A: Yes.

Q: Is there an archive of the video I can watch later if I can’t make it?
A: No.

Q: Will there be a summary of the video?
A: A short summary will get added to the comments of this posting after the video – assisted by Zoom AI because I can’t think for myself anymore and need to let the computer do it!

Q: Will there be some other video presentation in the future?
A: Most likely, yes. Hopefully sooner than in 16 months.

Spot oil windfall

When will we start hearing, once again, “Windfall profit taxes” in relation to oil prices?

Eyeballing the chart, we have spot WTI US$60 for January, US$65 for February and so far in March, let’s call it US$85.

Just as an example, we look at Cenovus’ sensitivities:

CAD$220M/year in “adjusted funds flow” sensitivity per dollar of WTI, so a first-cut analysis of a US$20 one-month change in WTI would be about CAD$370M in cash flow, or about 20 cents a share. For a single month of elevated pricing.

Suncor is about C$215M/year per US$1 change in WTI. CNQ forces you to do your own homework, but very roughly, my paper napkin has a model going from US$65 to US$85 WTI resulting in a change from $4 to $7/share in free cash flow (assuming things go for a whole year).

Given the extreme slope on the oil futures curve (spot oil being US$88, give or take, while December 2026 crude is US$75, a 15% discount for patiently waiting 9 months for your delivery), this windfall is not expected to last. Or will it?