Today was a very interesting day for TC Pipelines MLP (NYSE: TCP) which is the USA MLP arm of TransCanada Corporation (TSX: TRP).
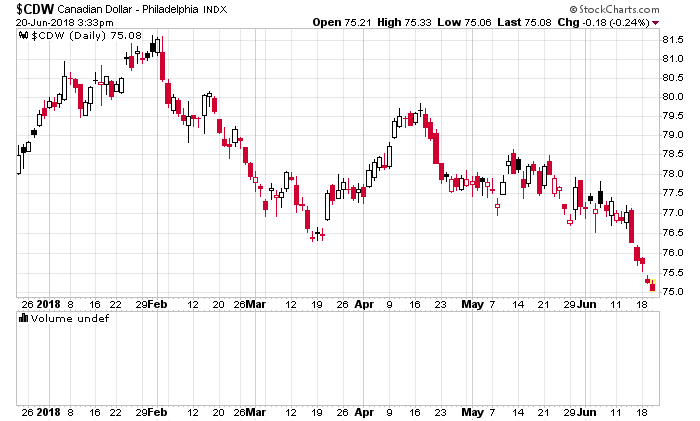
They were heavily impacted by a March 2018 FERC ruling concerning the calculation of regulatory revenue rates for oil and gas pipelines – essentially they were not allowed to incorporate the income tax expense of their unitholders into their rate calculations. Not surprisingly, the stock crashed in March (along with most other MLPs) and when TCP announced the subsequent consequence in their next quarterly report (May) they crashed even further. It is fairly evident by the stock chart when these moments occurred:
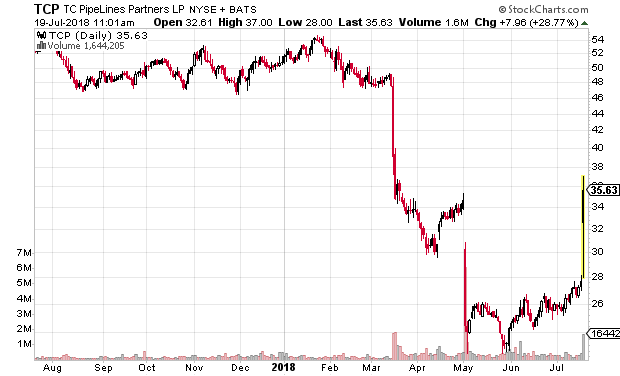
Today, the FERC partially backpedaled on this change announced in March for natural gas pipelines only (nothing mentioned on oil pipelines). According to my read of the commissioner’s details, they came to the conclusion that the underlying natural gas pipeline legislation had technical issues which did not allow them to enforce the previous order. Putting a long story short, they came to the conclusion that this change would be considered retroactive rule-making and hence they did not have the authority to implement the change. They provided a mechanism where gas pipelines could voluntarily consent to changes in exchange for the commission to not review their rates within a certain time period, but I doubt MLPs will exercise this if such changes are adverse.
This is effectively a reversal of the decision unless if Congress decides to intervene in the matter. Considering the perpetual dysfunctional mess in Congress and them not touching the underlying legislation to correct this matter, this is a huge victory for natural gas MLPs.
Finally, the rationale for TCP MLP dropping from $50 to $25 in the first place has completely evaporated – although interest rates have increased somewhat (causing some headwinds in the MLP price due to simple spreads over the risk-free rate), one can make an argument that the price should be restored close to previous levels. In other words, there is an argument to be made that the price should go even higher.
The FERC ruling does not appear to affect crude oil pipelines (this is a very loaded sentence).
The disclosure I will make is that I own call options in TCP, which bypasses messy taxation issues of foreigners owning USA MLPs.
========================================
Addenda:
Very quick valuation notes, TC Pipelines (NYSE: TCP)
Units outstanding: 71.3 million
General Partner: (TSX: TRP), owning approx. 23% of the entity
Distributable cash flows, 2015/16/17: $290/313/310
GP/Incentive Distribution Rights: 2% below $0.81/quarter, 15% to $0.88/quarter, 25% above $0.88/quarter
Top-line Revenues/Equity earnings (2017): US$446 million.
Debt: $2.3 billion, staggered across various term facilities/bonds. Refinancing available, will pay slightly more interest in rising-rate environment when rolling over debt. YTM on May 2027 unsecureds: 4.7%
Paper napkin valuation: $310 million / 71.3 million units, $4.35/unit, $35@12%, $42@10%. Does this warrant a 700bps or 500bps spread over debt? Historically was trading around $45-$50 (MLP sector was ‘more sexy’, perceived as ‘ultimately safe’, etc.)
Previous distributions were $1.00/quarter, but post-FERC, reduced to $0.65/quarter, citing debt ratios and anticipated reduction of revenues.