I noticed that the debentures of Accord Financial (TSX: ACD.DB) has fallen off a cliff:
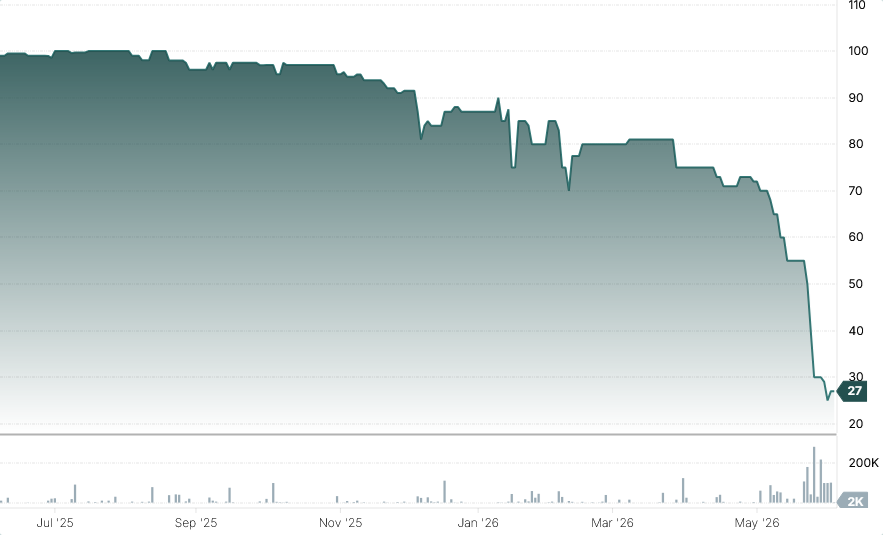
There should have been a hint of what was going on earlier this year when they extended the debenture term and increased the coupon rate (to now 12%) but the firesale of assets has made it quite clear that the subordination of the public debentureholders is not placing them in a very good position to negotiate – let alone getting payment on maturity.
Is it really that much of a train wreck? Let’s quickly examine things. Their March 31, 2026 balance sheet:
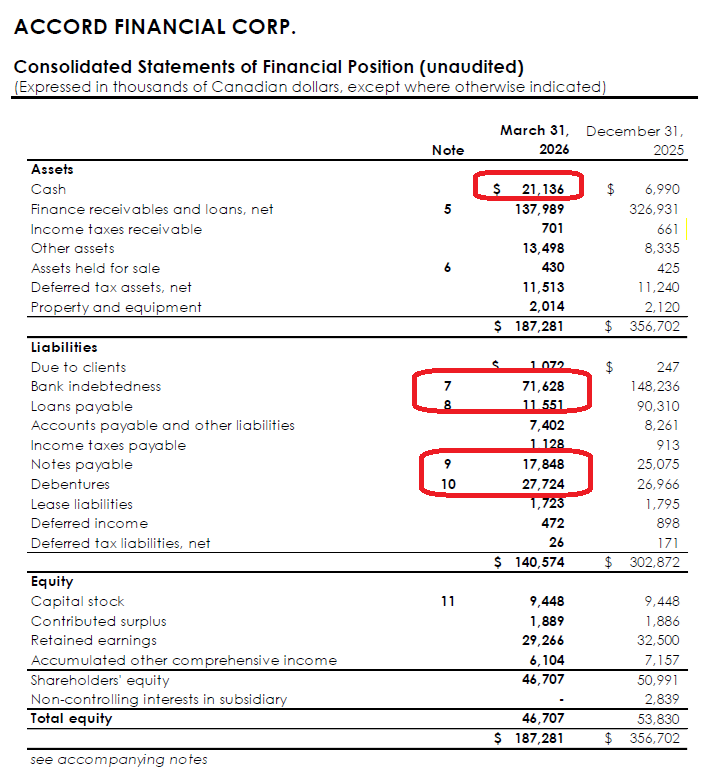
We have $21M in cash, and $138M in “finance receivables”.
This is what is needed to pay off notes 7, 8, 9 and 10 (the debt capital used to issue the loans).
Note 8 is a non-recourse loan. Note 7 is the primary credit facility with the bank (extended to June 19, 2026… they’re doing things nearly in monthly increments, never a good sign!). Note 9 is for notes payable, linked with the maturity date of the bank loan from a related party (the related party keeping the corporate entity afloat… for now). Note 10 is the $20.65 million in publicly traded debentures and $5 million in non-listed debentures (same terms). They mature on July 31, 2026.
When doing the math, you have about $159M in financial assets that are going to pay off $127M in loans and debts. That’s nearly $30M leftover, so surely paying off those debentures is going to be no problem, right, right??
The finance receivables are the lion’s share of assets and they are primarily structured to within 1 year of repayment:
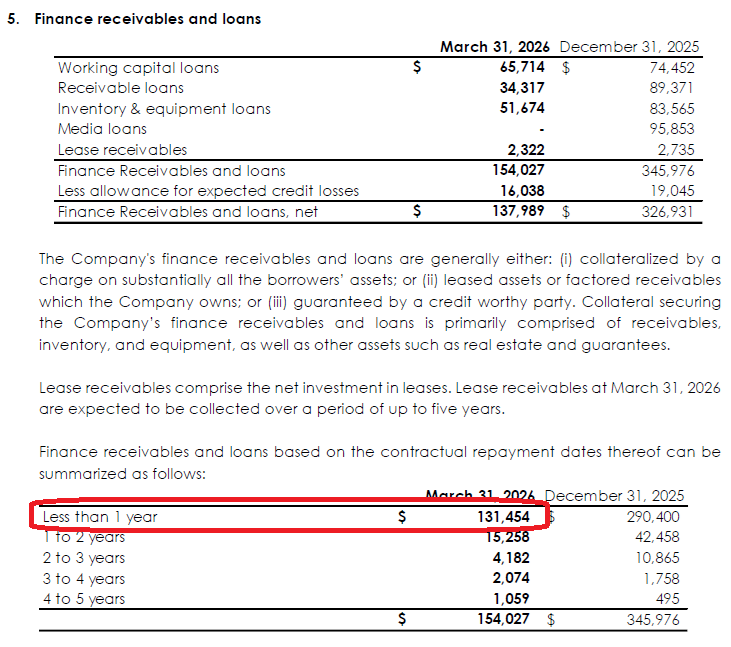
Looks good, right? What’s the issue?
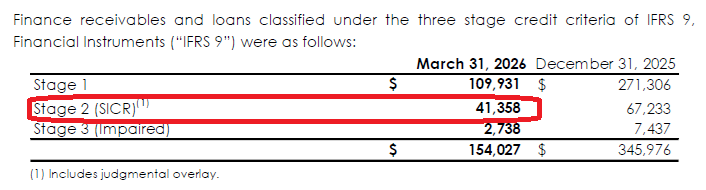
SICR is a “significant increase in credit risk” measurement.
So it turns out that about $41 million in loans are at risk. This makes the threshold for repayment much more narrower. Coupled with the fact that the corporation is loss-generating (specifically the interest expenses and G&A is well higher than the interest income being generated by the loan portfolio), the trading price of the debentures is not surprising.
Finally… the irony wasn’t lost on me when looking at the first page of their quarterly report: