In a world where the headline article is the USA publishing an annualized CPI for May of +4.2%, you would think that precious metals would be the recipient of capital inflows – supposedly a great hedge on inflation – as governments run higher and higher deficits and the supply of money expands to infinity, precious metals will flourish, correct?
Apparently not:
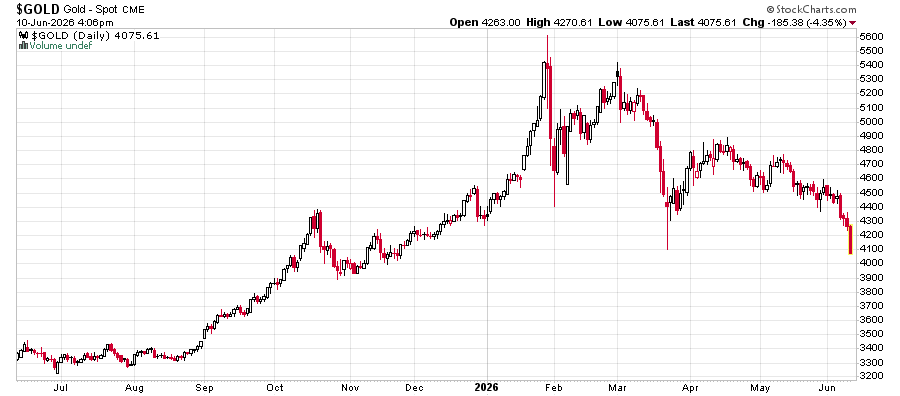
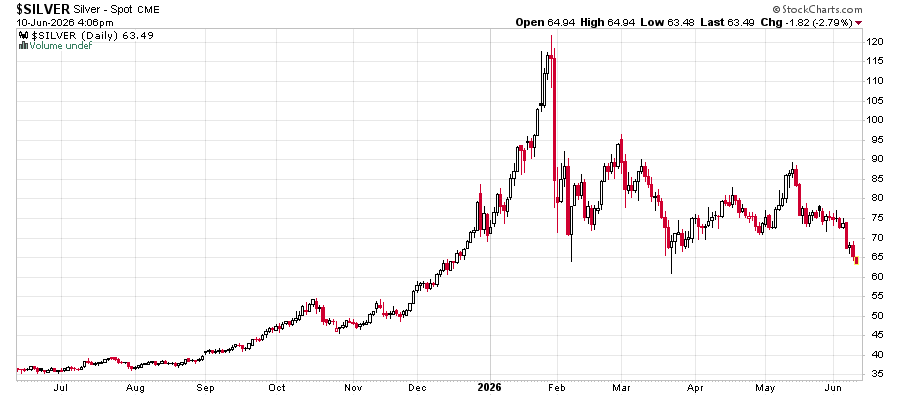
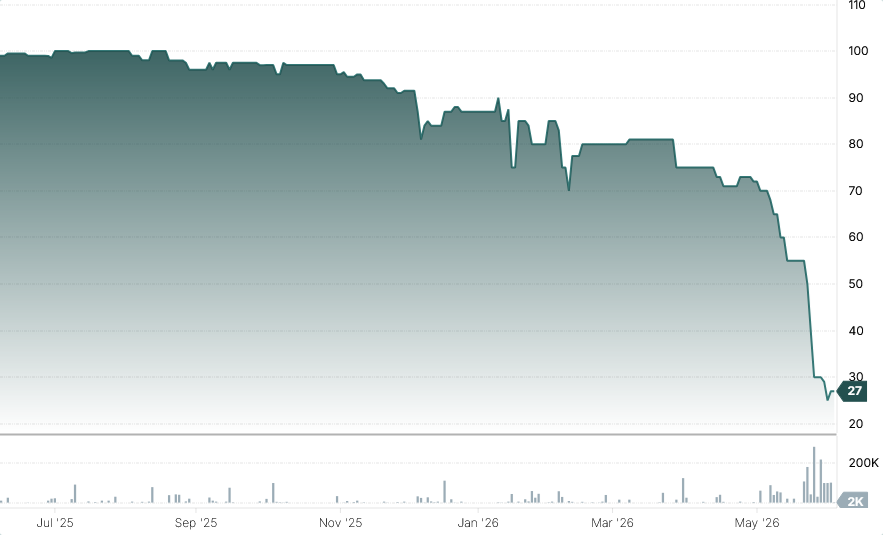
Gold and silver have been trading down, especially since the precious metals price spike last January. Somebody buying Silver at that $120 spike is sitting just under a 50% loss at present.
What do we make of these conflicting narratives?
Prices are set at the margins. It takes one trade for a price to drop from $100 to $10 – if somebody is willing to sell it at 10 dollars and nobody is willing to buy it between $10.01 to $100.
What triggers the sale? The need for liquidity – converting an asset class into cash, and this need is more than the desire of the purchasing party to pay up for it.
The advantage of owning an ounce of gold or silver is that it sits there. It doesn’t depreciate. It will be there forever, irrespective of whatever happens to the entire monetary system. The disadvantage is that it sits there. It doesn’t earn a yield. To convert this asset into something useful, you need to find somebody willing to take it and give you something in return for it that you want – typically cash. If too many people want cash, you’re less likely to receive more for it.
It is very difficult to predict the eddies and currents of when you will see demand for precious metals or seeing people needing liquidity and selling their gold and silver instead of US Treasuries or Bitcoin or shares of NVidia.
“Sell in May and Go Away” is a popular cliche in the markets – perhaps this year it is especially true. I continue to remain very defensively positioned despite the pain of seeing a USA CPI print of 4.2% and the best low-risk short duration ETF I can find on cash equivalents gives out a net of 2.6%. What will break first, the purchasing power of cash or the stock market?